Sweden › Stockholm › Solna · street
Living on Kolonnvägen.
33 buildings stand along its 2,380 m in Solna. The 4 DeSO areas it runs through have a mean net income of SEK 417k, and 57% of their dwellings are bostadsrätter. Ulriksdal (rail) is a 2-minute walk.
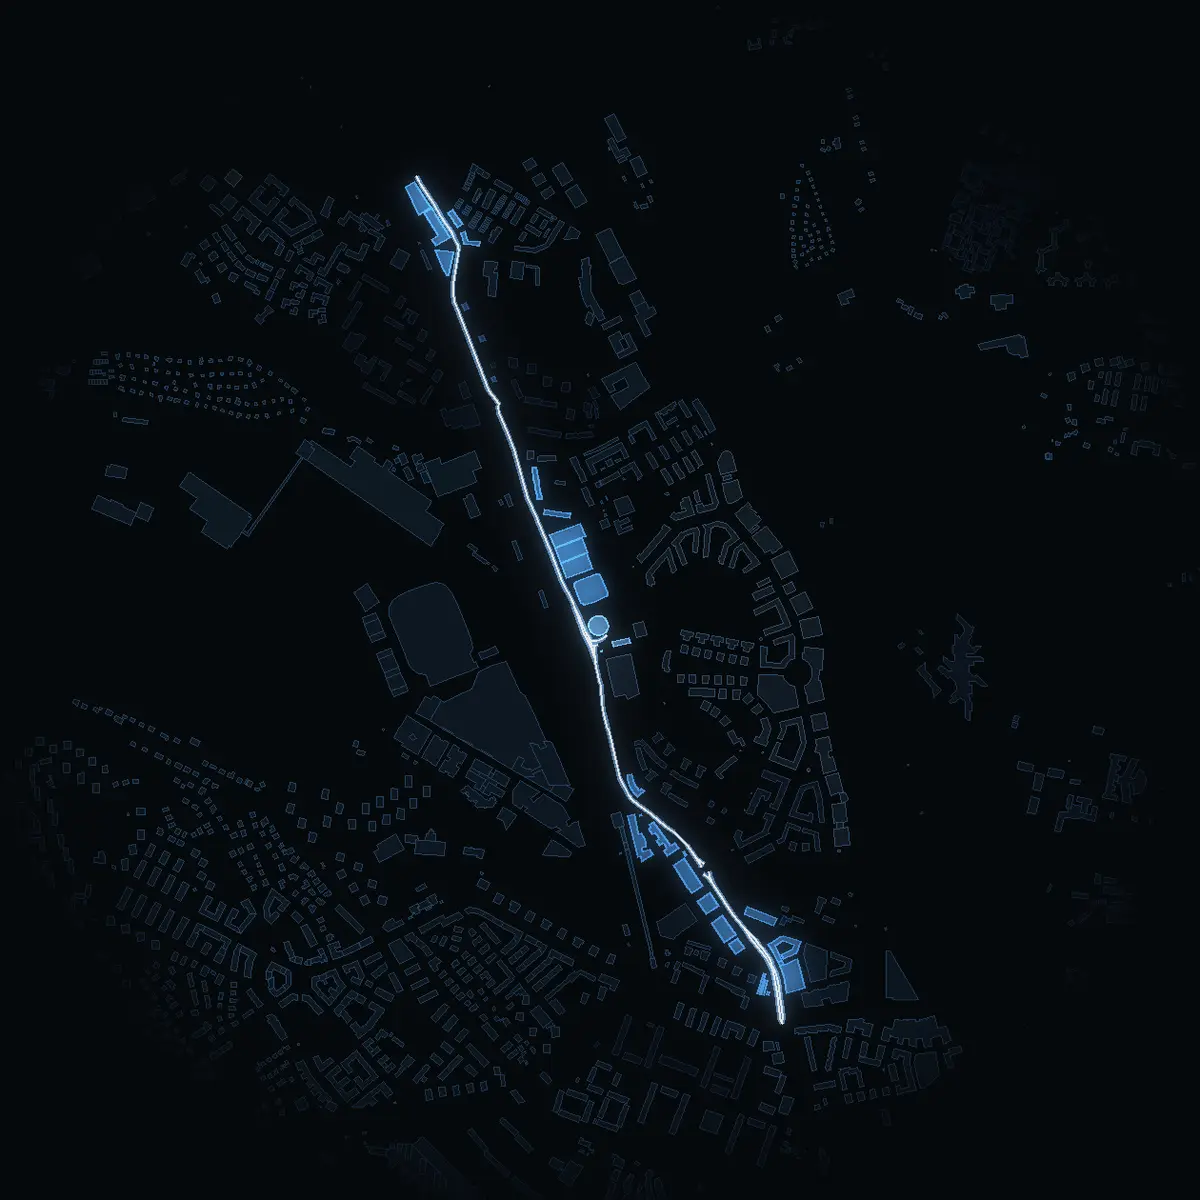
The street as OpenStreetMap maps it, its area as SCB counts it. VERA PI shows no street price in Sweden – why, below.
The street
Kolonnvägen, as it stands.
Kolonnvägen is a local through road of about 2,380 m in Solna. OpenStreetMap draws 33 buildings within 25 m of its line, typically 4 floors high where the floors are mapped (23 of them).
What the buildings are
OpenStreetMap’s own tags – most Swedish buildings carry no use, so «not tagged» is common and says nothing about the building.
The area around it
Who lives around it.
The street runs through 4 of SCB’s DeSO areas – Frösunda, Nya Ulriksdal-Södra Ritorp, Bagartorp-Agnesberg. Together they have 9,447 people (2025) with a mean net income of SEK 417k (2024), +0.9% against Solna as a whole. These are the areas’ figures, not the street’s: SCB counts people by area, never by street.
How the dwellings are held
Dwellings in the DeSO areas the street runs through, 4,719 in all.
Against Solna
- Mean net incomeSEK 417k here · SEK 414k in Solna
- Bostadsrätt57% here · 63% in Solna
- Rented40% here · 35% in Solna
People 2025, net income 2024 and dwellings by tenure by DeSO area: Source: Statistics Sweden, CC BY 4.0 – an area counts where at least a tenth of the street runs through it.
Getting around
Stations, schools and parks.
The nearest stop is Ulriksdal – 140 m on foot, about 2 minutes. 9 school units stand within 500 m of the street.
The nearest stop of each kind
The walk is measured along OpenStreetMap’s streets and paths from the nearest point of the street, at 80 m a minute – never shorter than the straight line, which is shown beside it.
| Kind | Stop | Walk | Time | Straight line |
|---|---|---|---|---|
| Tunnelbana | Solna centrum | 1,490 m | 19 min | 1,130 m |
| Rail (pendeltåg, Roslagsbanan, Saltsjöbanan) | Ulriksdal | 140 m | 2 min | 60 m |
| Tram and light rail | Solna station | 510 m | 6 min | 390 m |
School units within 500 m
Active units in Skolverket’s register, by distance from the street.
- Ulriksdalsskolan80 m · compulsory, pre-school class
- Noblaskolan Solna200 m · compulsory, pre-school class
- Raoul Wallenbergskolan Bagartorp250 m · compulsory
- Dibber Rullen anpassad grundskola300 m · pre-school class
- Dibber Rullen anpassad gymnasieskola300 m
- Hagaskolan310 m · compulsory, pre-school class
- Haga VIP anpassad gymnasieskola330 m
- Haga VIP anpassad grundskola330 m
- Vittra Frösunda360 m · compulsory, pre-school class
Parks near it
Named parks whose centre lies within 600 m, the largest first.
- Lilla Frösunda park1.8 ha · 70 m away
- Fröfjärdsparken1.3 ha · 300 m away
- Lövdalsparken0.7 ha · 550 m away
- Vasalundsparken0.5 ha · 410 m away
Stops, streets, paths and parks: © OpenStreetMap contributors, ODbL 1.0. School units: Skolverket’s school-unit register (open data).
Prices – kommun level
The prices of Solna.
SCB publishes sale prices by kommun and län – not by street. These are Solna’s and Stockholms län’s, never Kolonnvägen’s.
Solna’s prices since 1981 · Stockholms län’s bostadsrätter since 2000
Sales of småhus by kommun and of bostadsrätter by län: Source: Statistics Sweden, CC BY 4.0.
What VERA PI does not show here, and why
- No individual sale. The price of a house or an owner-occupied flat sits in Lantmäteriet’s register of sale prices (fastighetsprisregistret), which is not open data; SCB publishes it as statistics by kommun and län, and those are the prices shown here. A bostadsrätt is a share in a housing association, not real property – its sales are in no public register at all (the figures for bostadsrätter are SCB’s statistics by län).
- No prices below the kommun: SCB does not publish sale prices by stadsdel or DeSO. The night picture is coloured by the mean net income of each DeSO area, never by a price.
- No property boundary, no address file and no building’s own record: Lantmäteriet’s open property, address and building data (high-value datasets, CC BY 4.0) are released only on an approved application, which VERA PI has not yet made.
- No asking prices and no listings: Hemnet’s and Booli’s terms do not allow their listings to be copied, and VERA PI does not copy them.
- No estimate for a home: without sale-level data an estimate would be a guess, and VERA PI does not publish guesses.
- No price for this street: SCB publishes sale prices by kommun and län only, so the prices shown are Solna’s and Stockholms län’s – never the street’s, and no ranking of streets by price.
- The buildings are OpenStreetMap’s outlines within 25 m of the street’s line, not an address register: Lantmäteriet’s address and building data are not yet open to VERA PI. A building on a corner counts for both streets.
Sources and licences
Every figure, and where it comes from.
Every figure is official statistics from Statistics Sweden (SCB) under CC BY 4.0 – «Source: Statistics Sweden» – for the period stated beside it; boundaries from SCB’s DeSO 2025 and Stockholms stad’s Stadskarta (© Stockholms stad, Stadsbyggnadskontoret, CC BY); school units from Skolverket; buildings, stations and parks © OpenStreetMap contributors (ODbL 1.0). Nothing here is a valuation. VERA PI has processed the figures (sums over DeSO areas, changes, ranks). Streets, buildings, stops and parks: © OpenStreetMap contributors (ODbL 1.0) – one street per name and kommun, its parts merged by VERA PI.
- Statistics Sweden (SCB) – Statistikdatabasenfastighetspriser och lagfarter (BO0501), bostadsbestånd (BO0104), hyror (BO0406), befolkning (BE0101), inkomster (HE0110); read 20 October 2026CC BY 4.0 · Source: Statistics Sweden · www.scb.se
- Statistics Sweden – DeSO 2025 (demographic statistical areas)2025_v2Open geodata, CC BY 4.0 · Source: Statistics Sweden · www.scb.se/vara-tjanster/oppna-data/oppna-geodata
- Stockholms stad – Stadskartan: stadsdelar and stadsdelsnämndsområdenStadsbyggnadskontoret, DataportalenCC BY · © Stockholms stad, Stadsbyggnadskontoret · dataportalen.stockholm.se
- Skolverket – the school-unit register and planned educationsopen APIs, read 20 October 2026Open data · Source: Skolverket · www.skolverket.se
- OpenStreetMap – buildings, stations and parksGeofabrik's Sweden extract, 2026-10-20ODbL 1.0 · © OpenStreetMap contributors · www.openstreetmap.org/copyright