


Akutmottagningen, Södersjukhuset
Sjukhusbacken 12 · 2.8 km
Open 24/7 · 08-123 621 20
Östermalm · Stockholm · Street guide
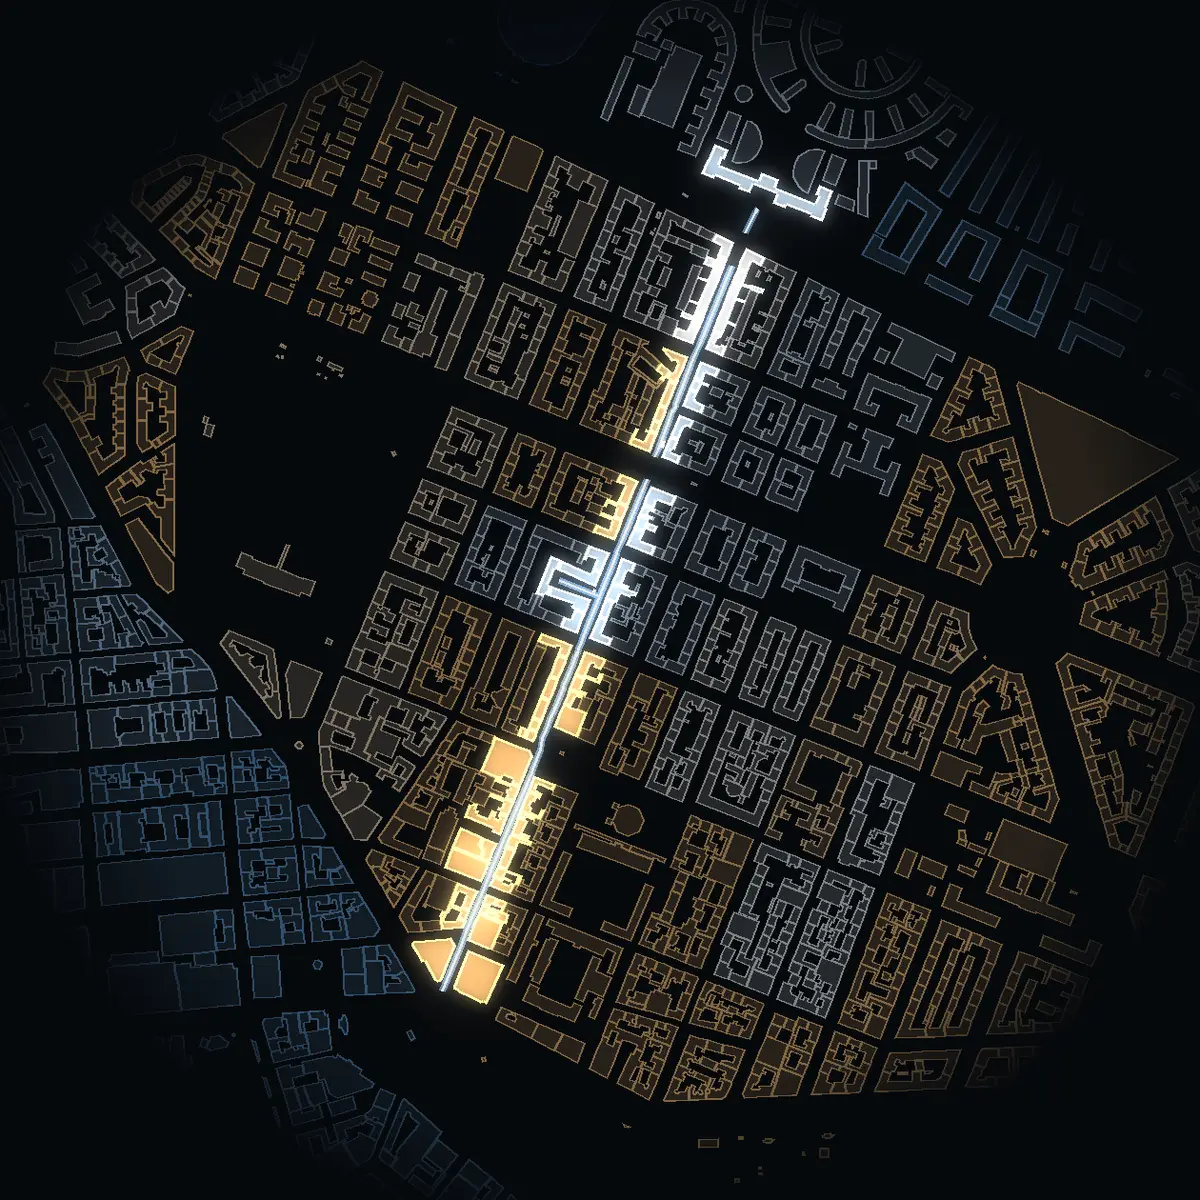
Nybrogatan is a residential street of Östermalm, 1,100 metres long from Nybroplan to Valhallavägen. Its houses went up between 1829 and 1970. Here is every house on it – when it was built, who drew it and who owns it today – and what this corner of Östermalm is like to live in.
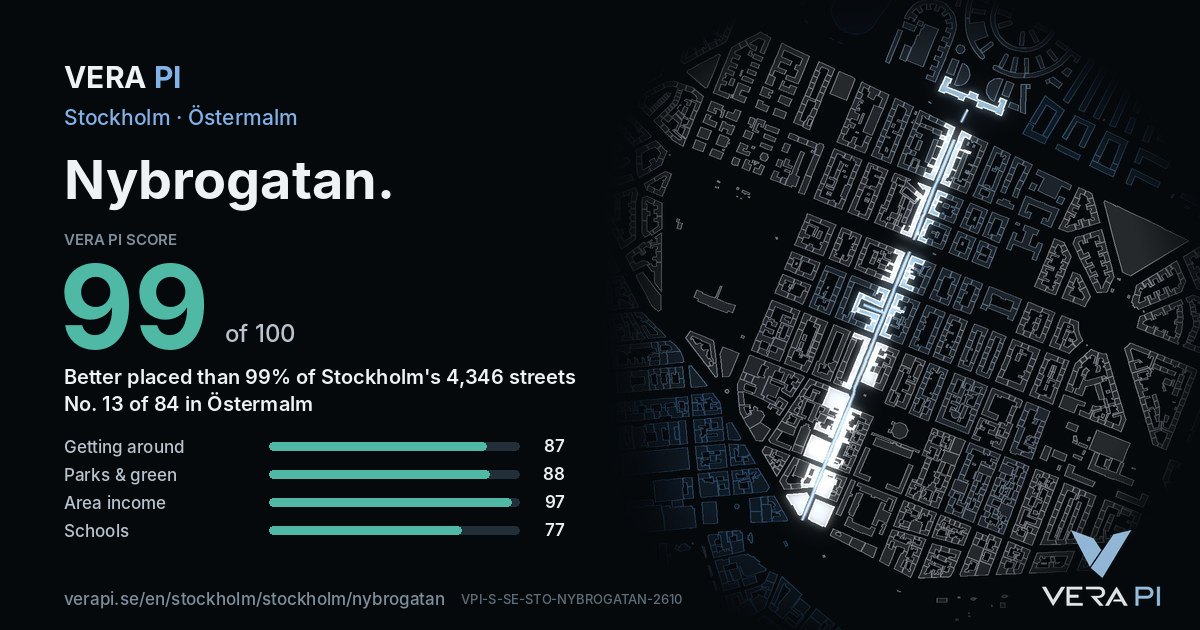
Better placed than 99 % of Stockholm's 4,346 streets – no. 13 of 84 in Östermalm.
Coming: Heritage – Stadsmuseet's inventories · Restaurants & culture · Safety – Brå · Air · Flood
Each part is a rank among all of Stockholms stad's streets; the parts are weighted and the total ranked again – the same measure for every street, so any two can be compared and shared. It is VERA PI's own ranking, not a price and not a valuation.
Every house on Nybrogatan with an address, on the map – its buildings drawn at their real heights from the city's 3D model. Walk along the street with the slider, switch between the odd and the even side, or tap a house.
Skip the mapThe bars are the houses at their heights from the city's 3D model – the odd side above the line, the even side below. Tap one to see the house.
65 houses with an address · 62 in Stadsmuseet's inventories. Tap one for its own page.
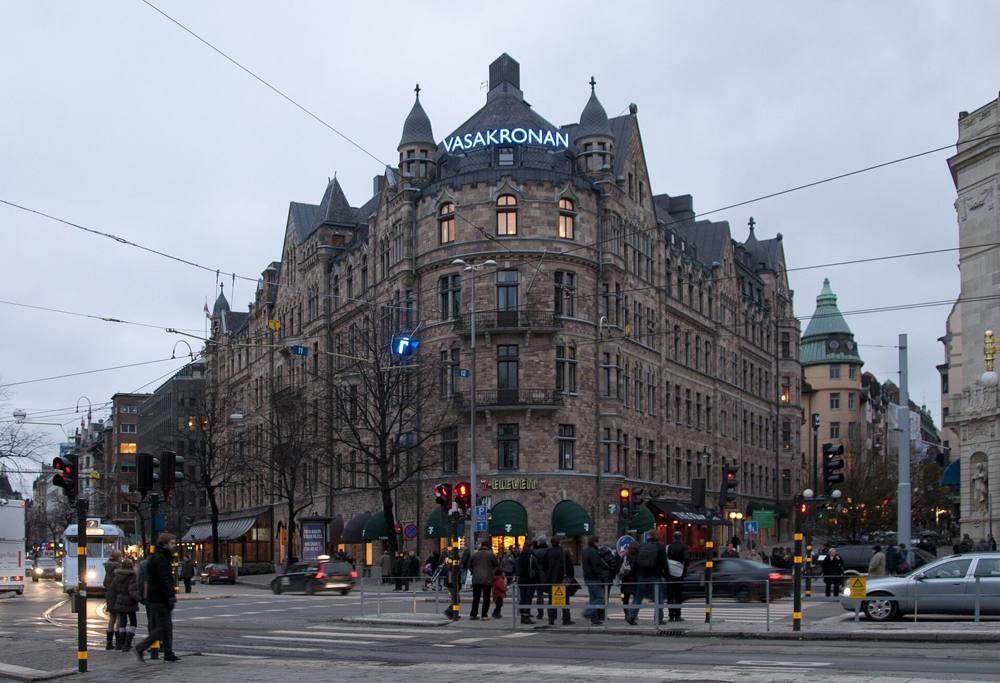
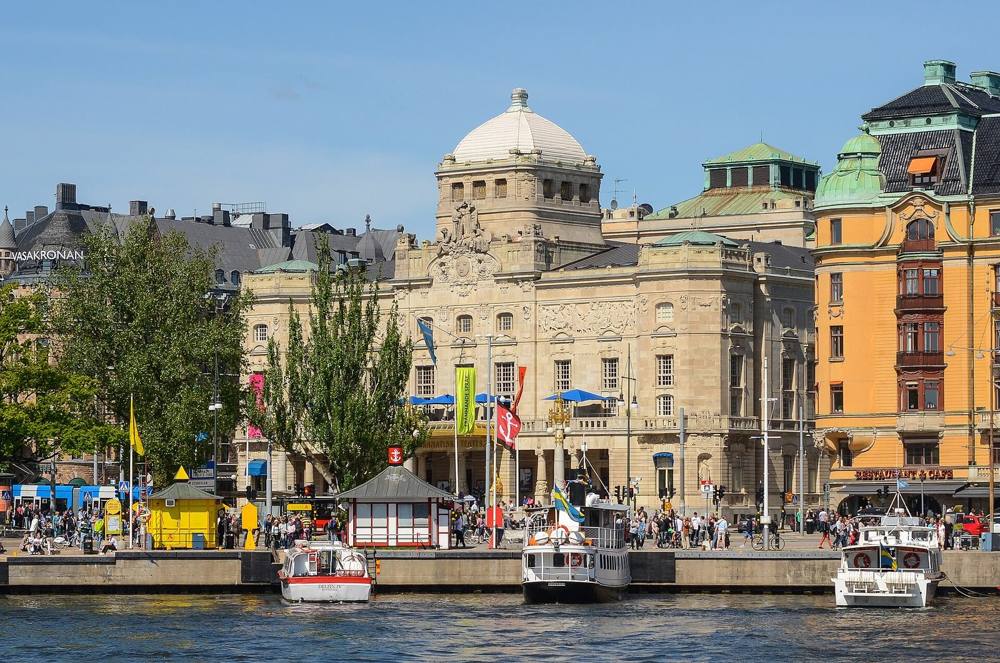
The houses of Nybrogatan in photographs, each under a free licence, credited to its photographer.
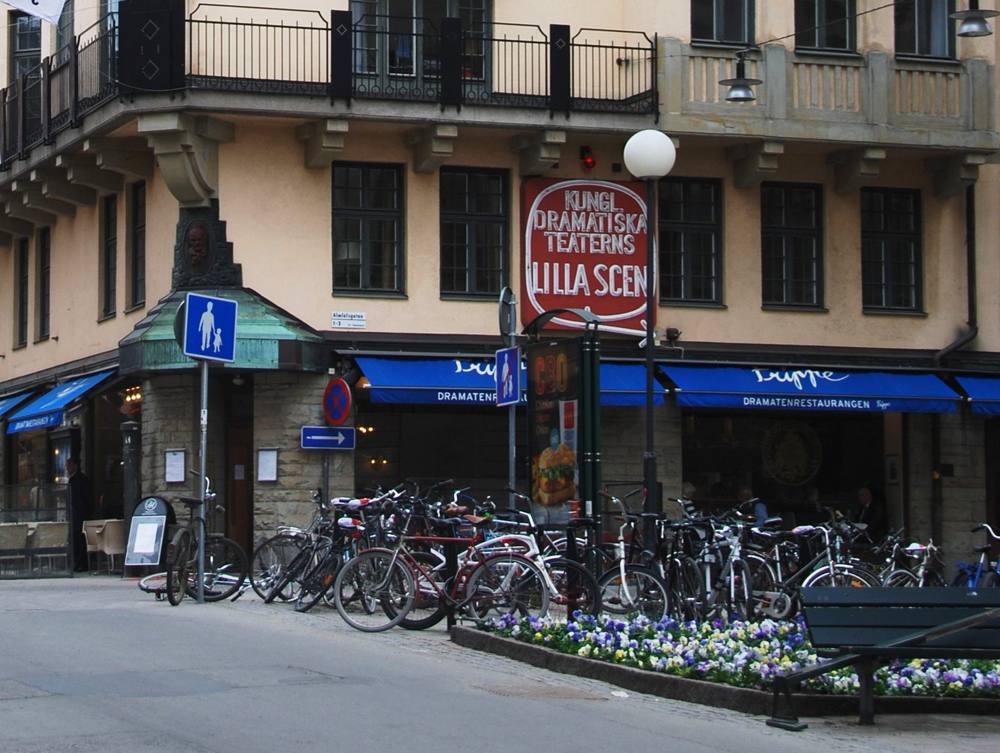
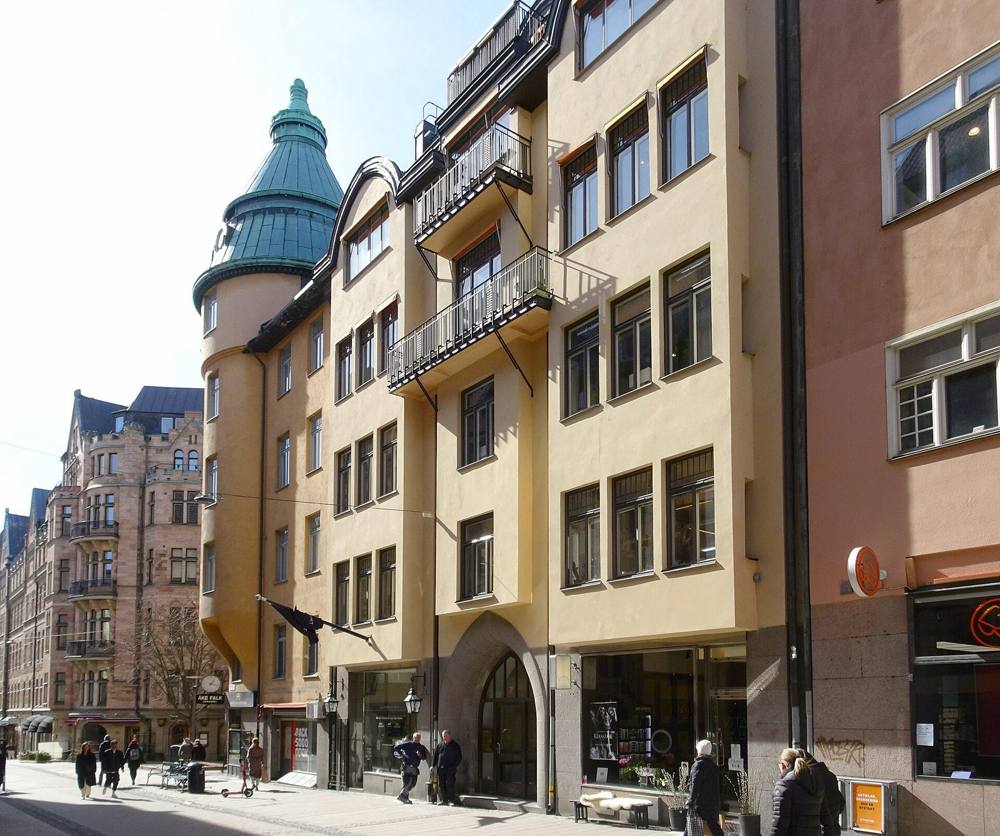
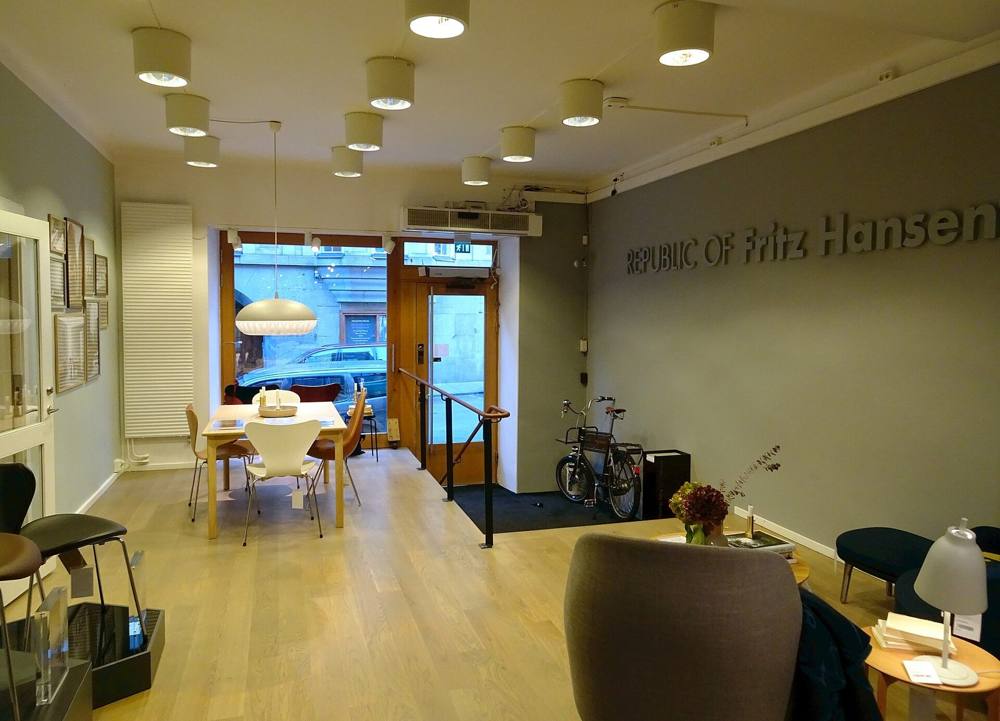
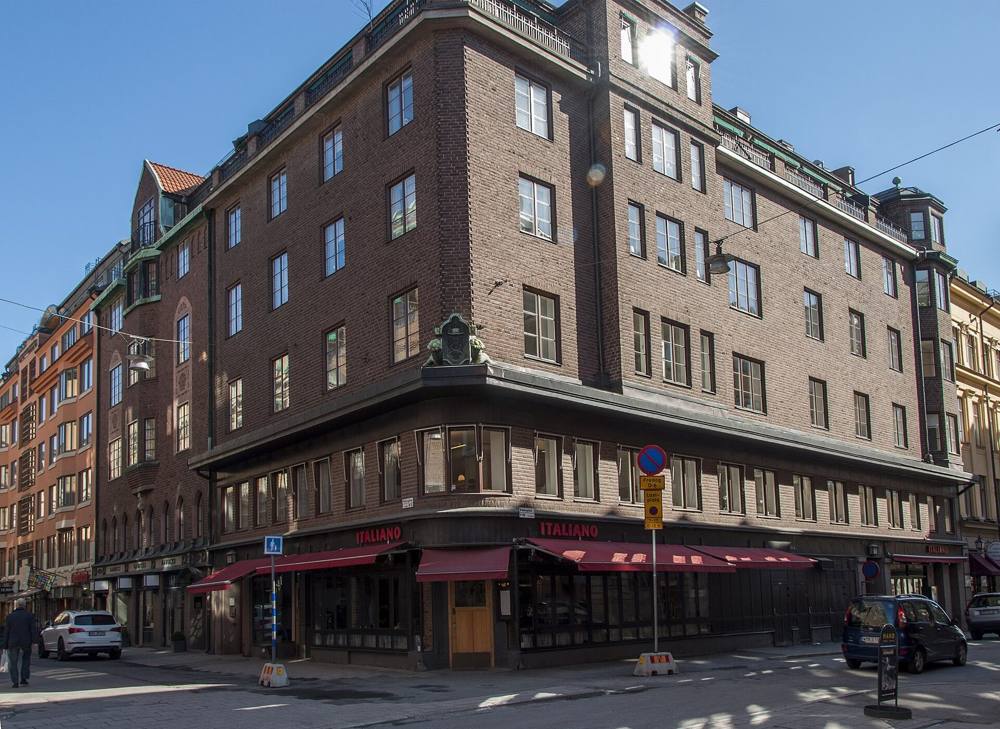
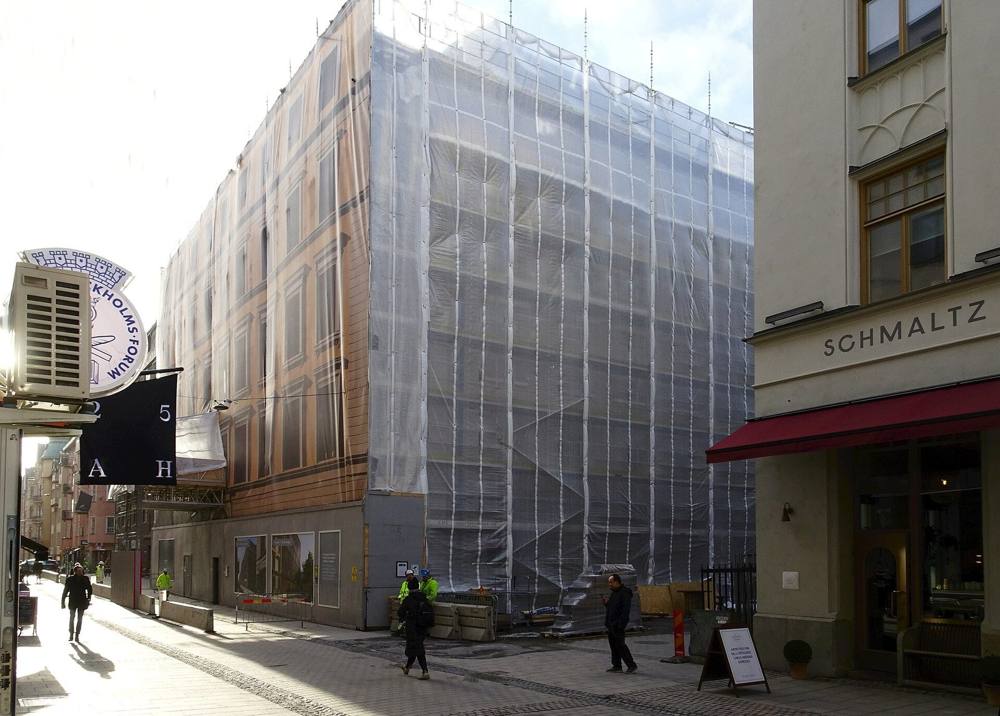
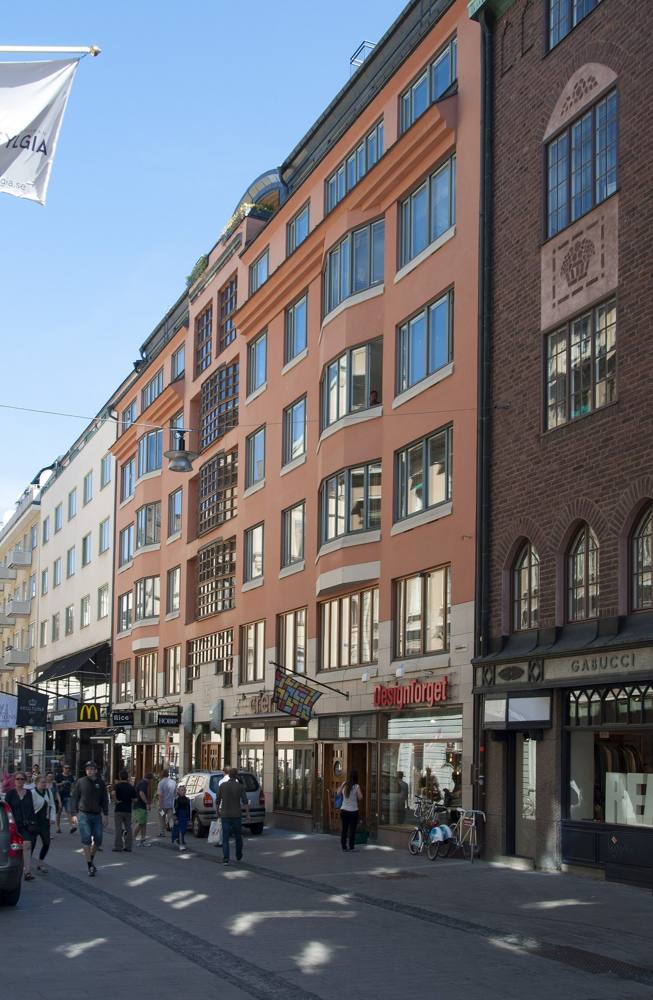
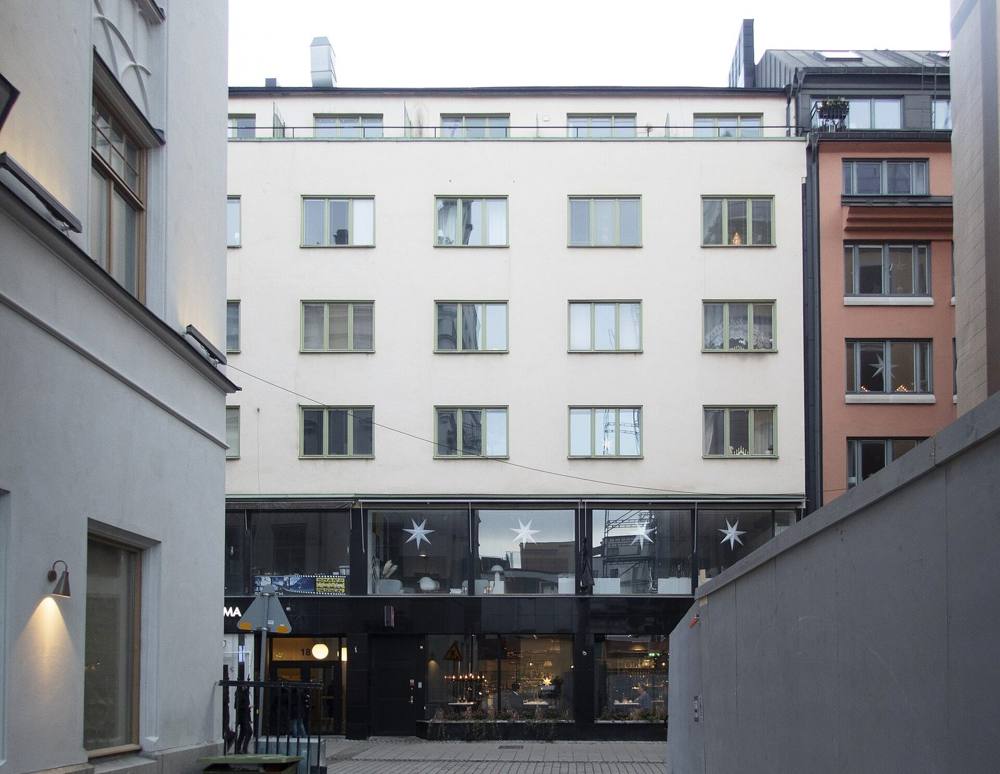
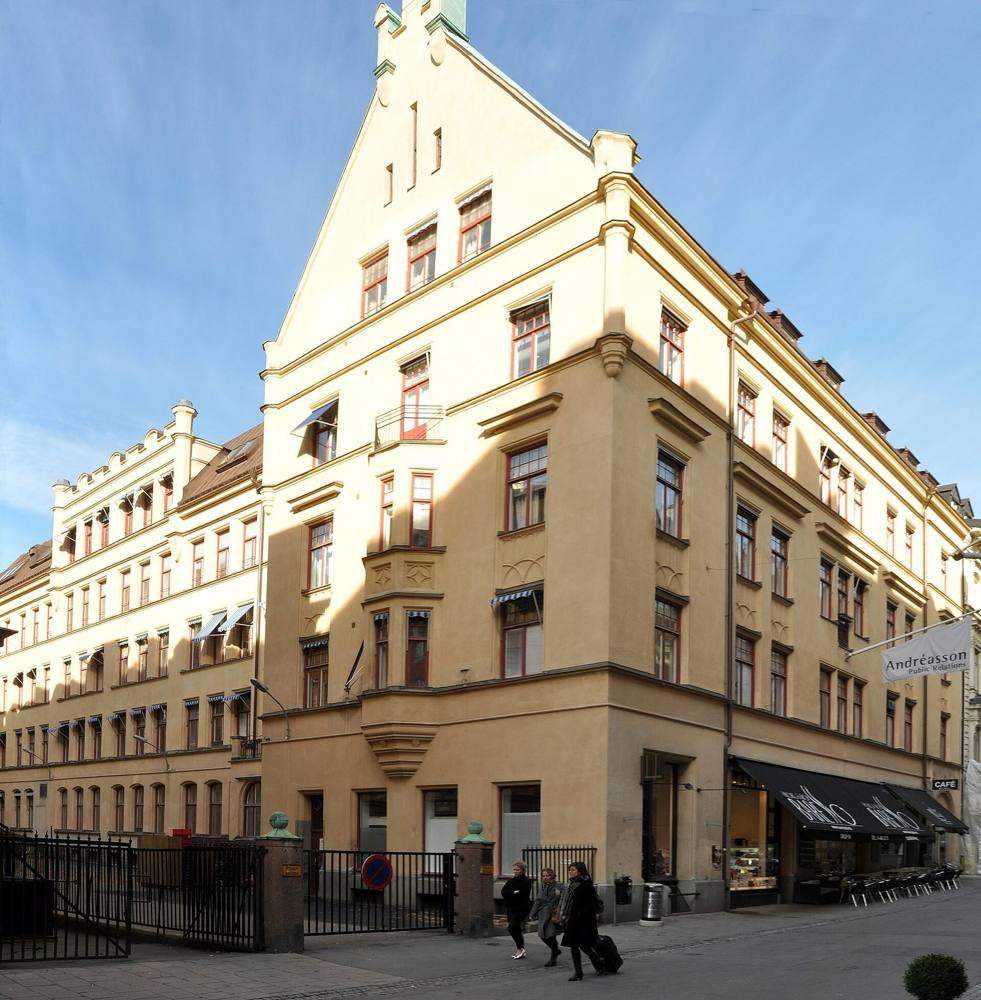
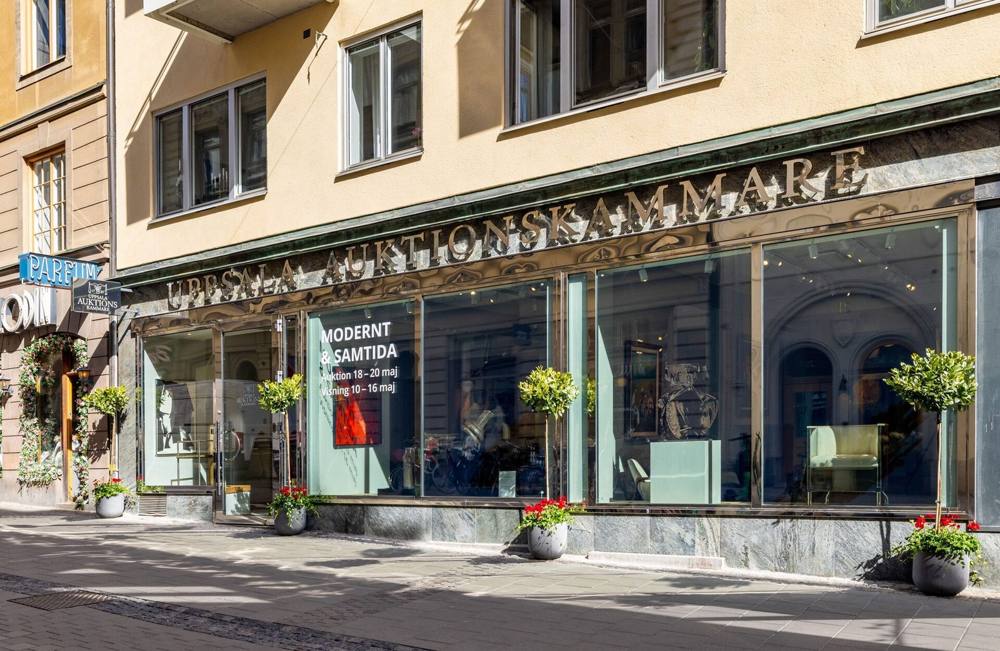
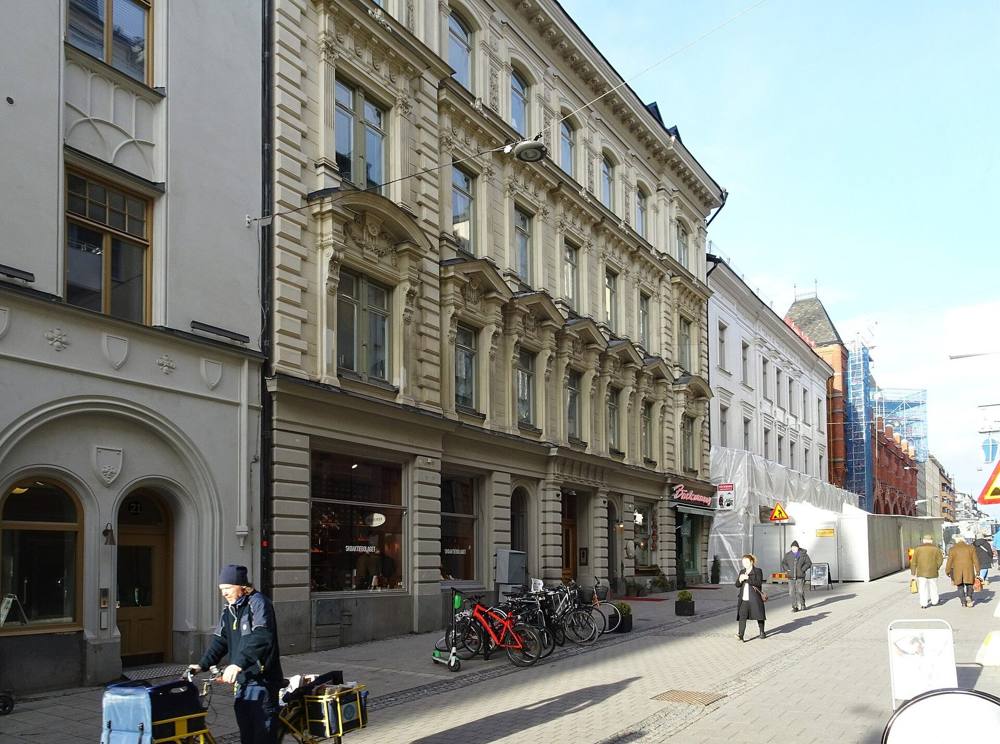
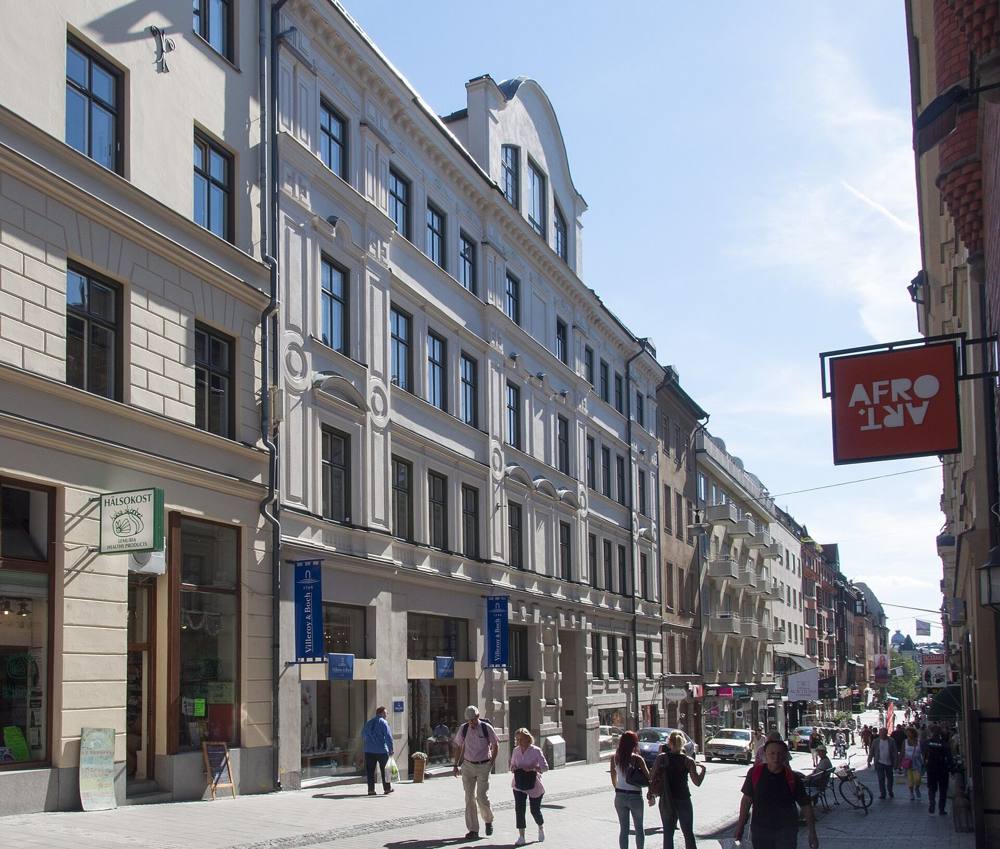
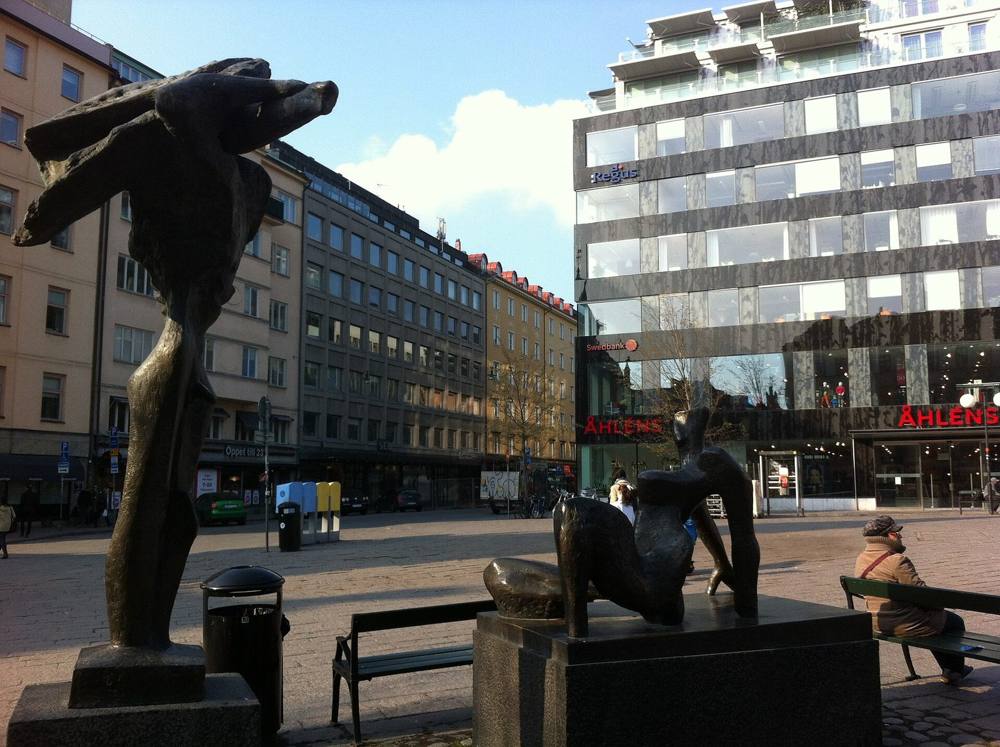
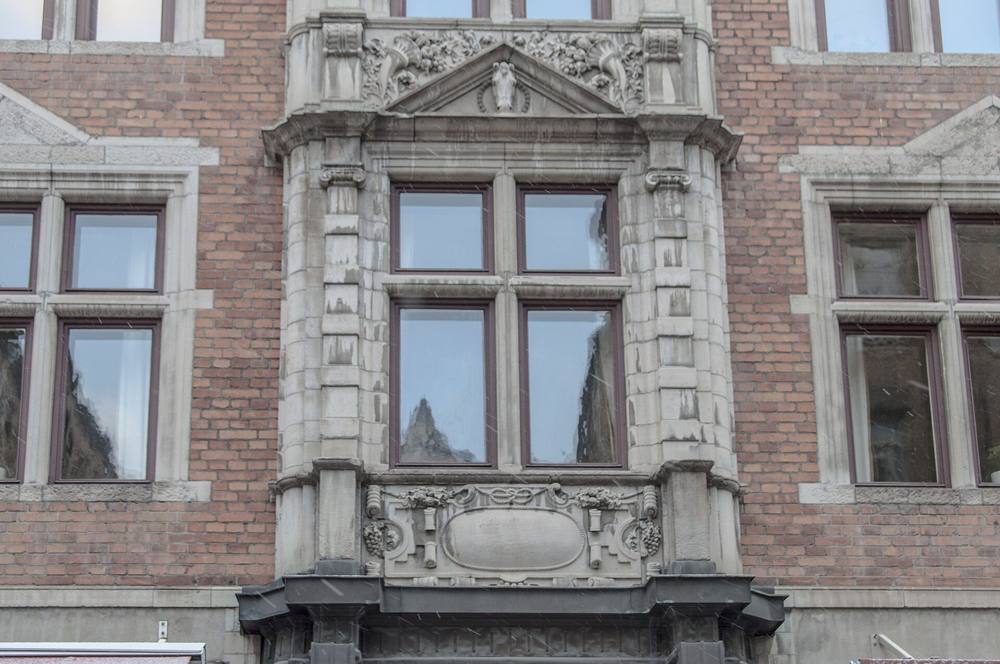
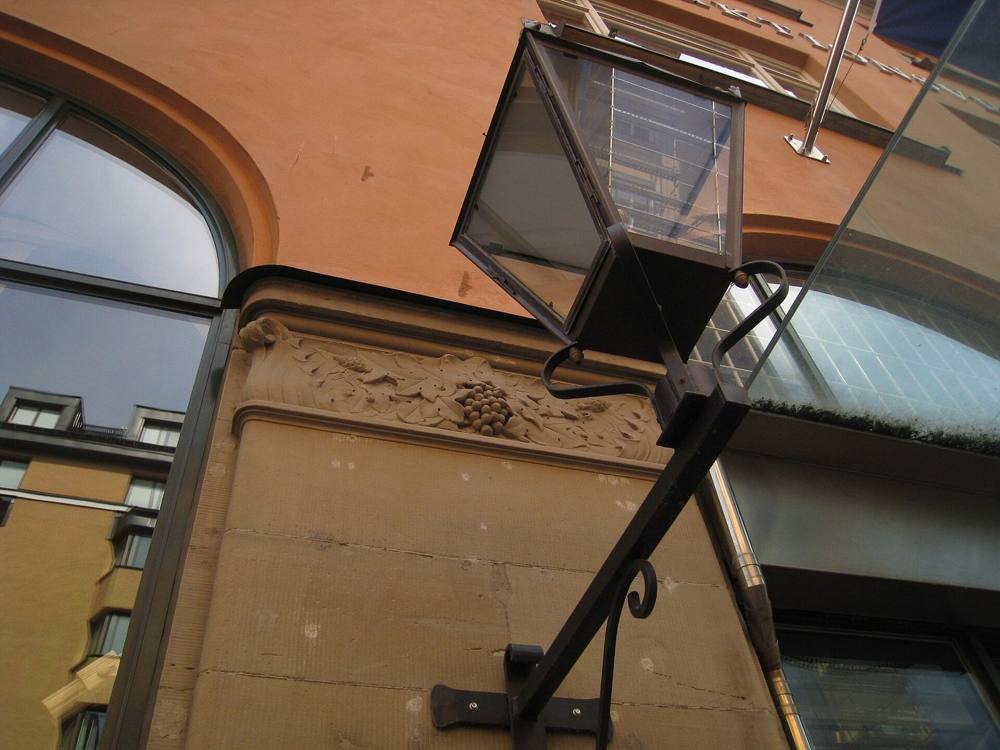
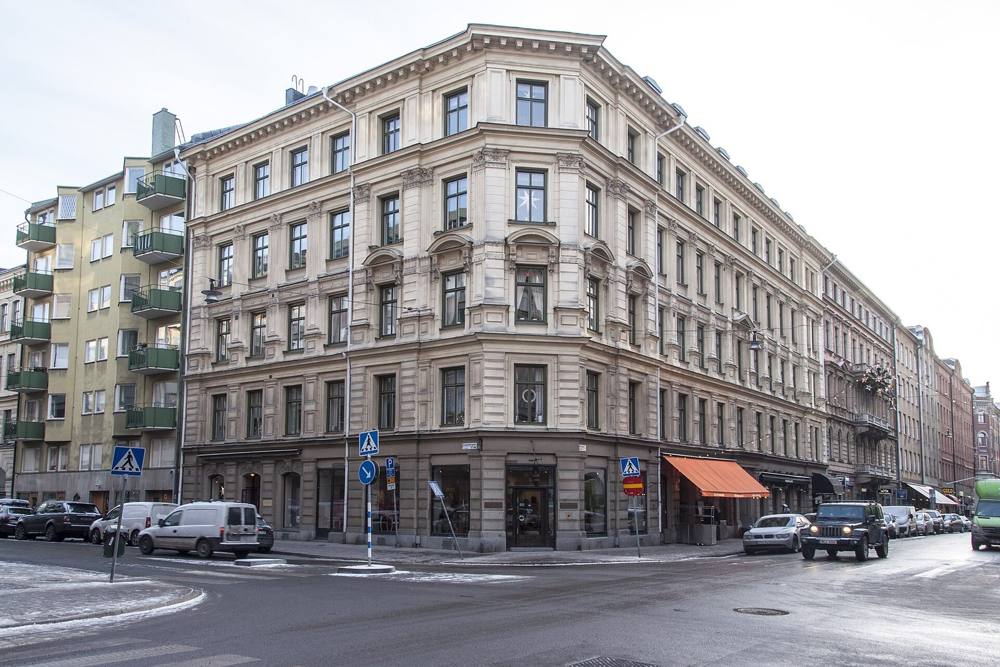
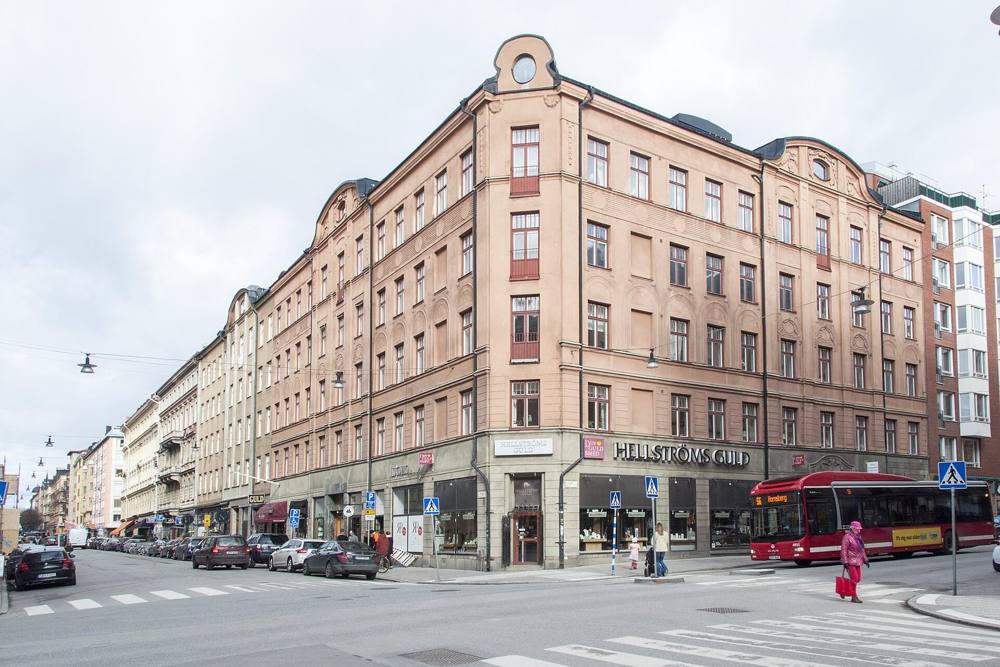
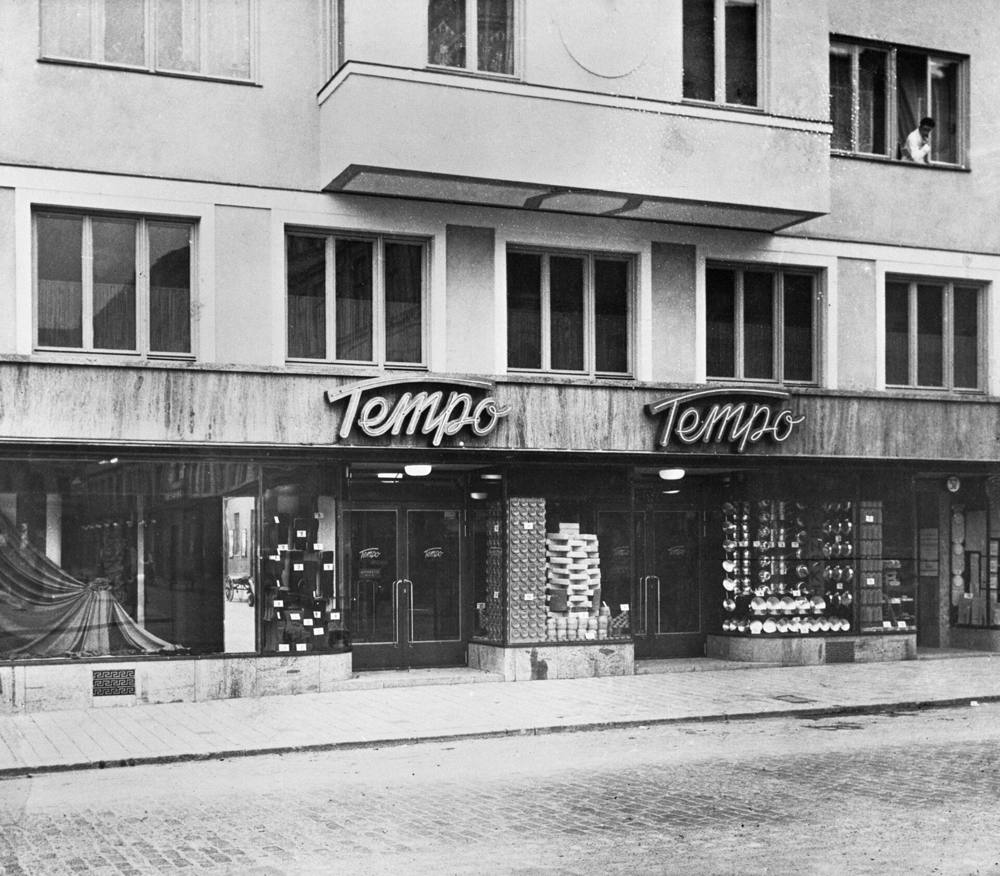
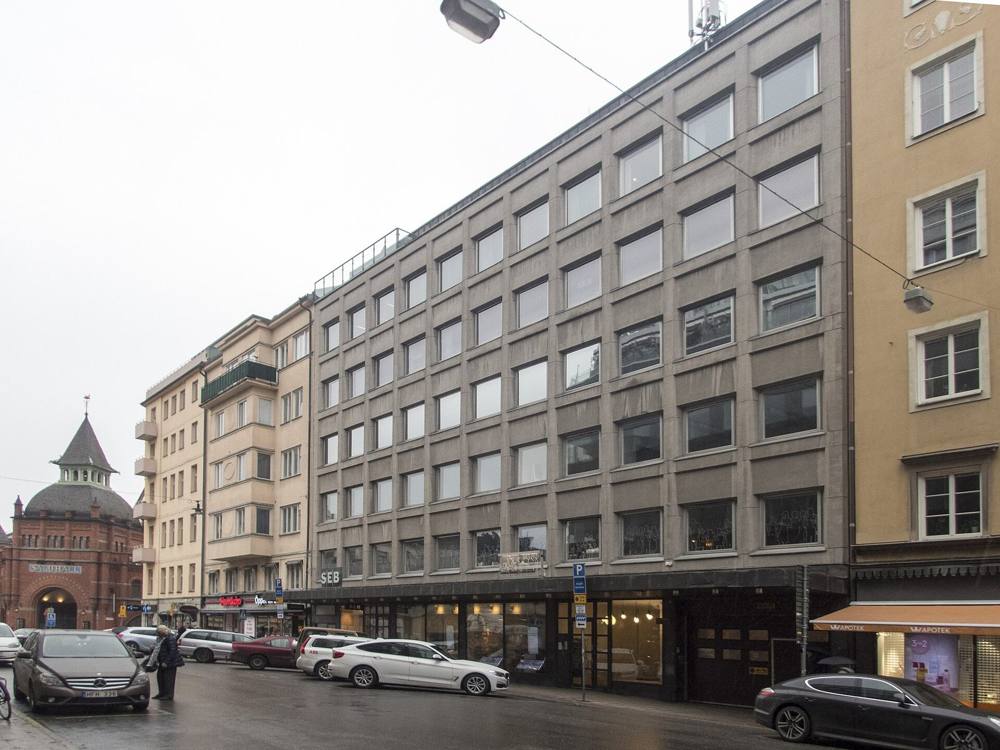
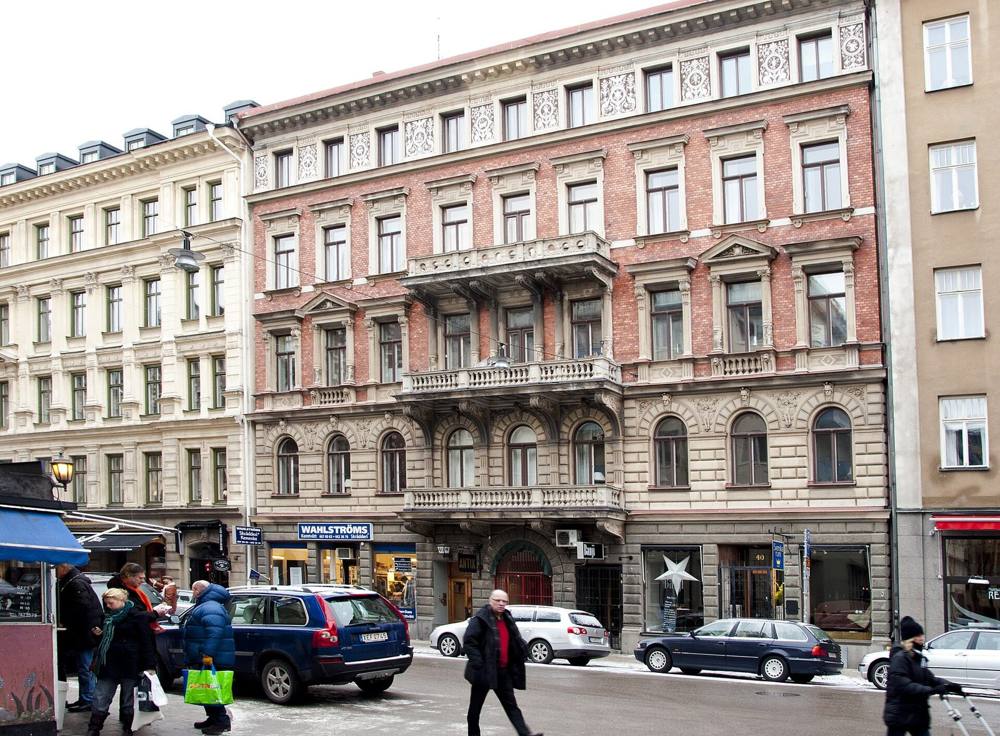
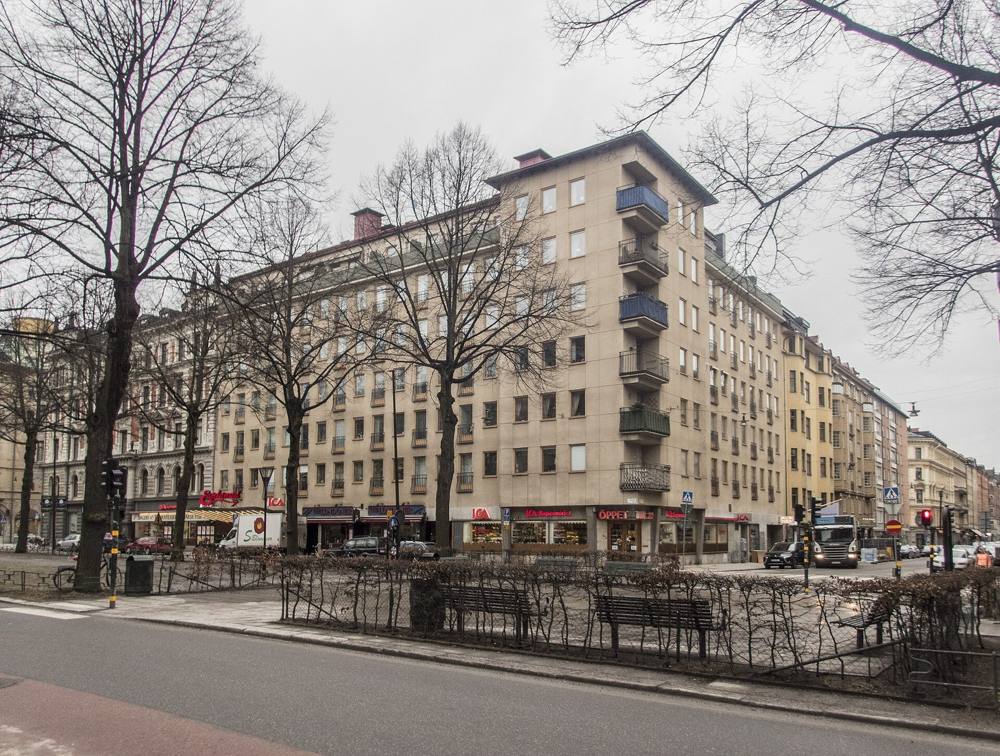
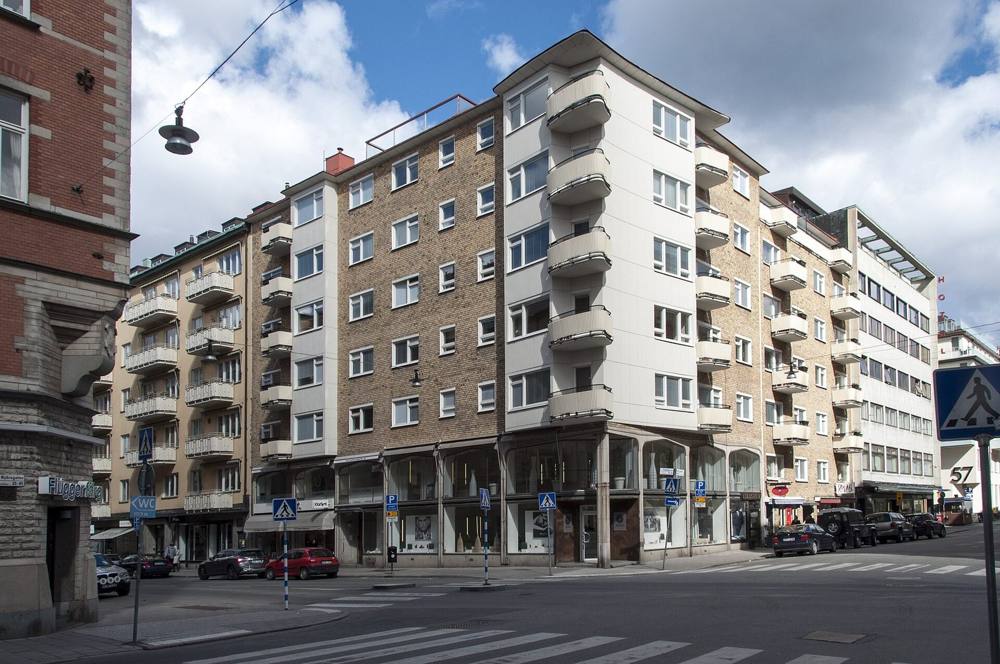
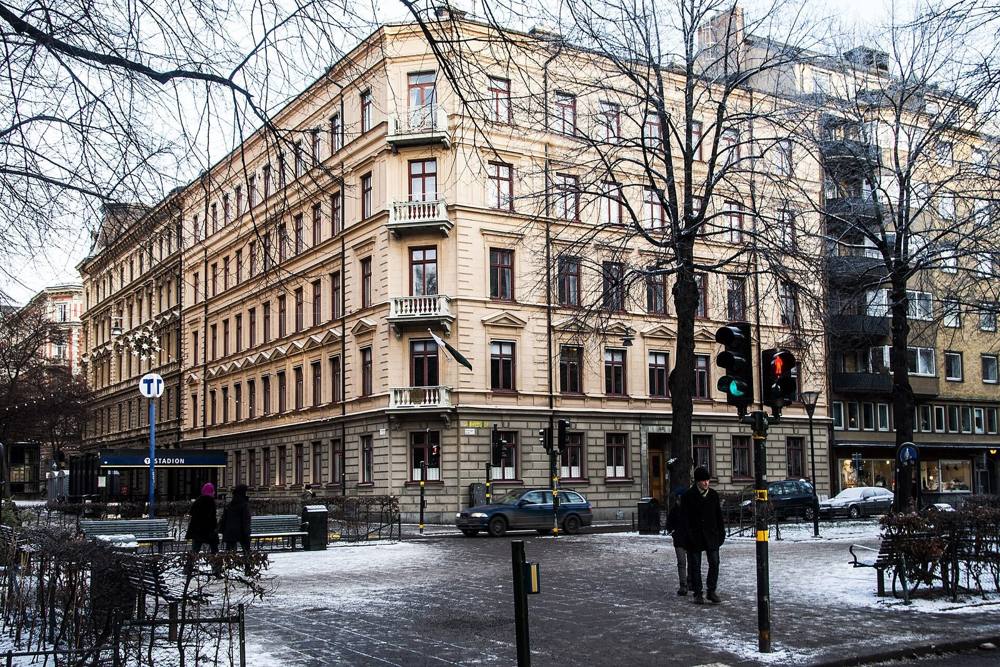
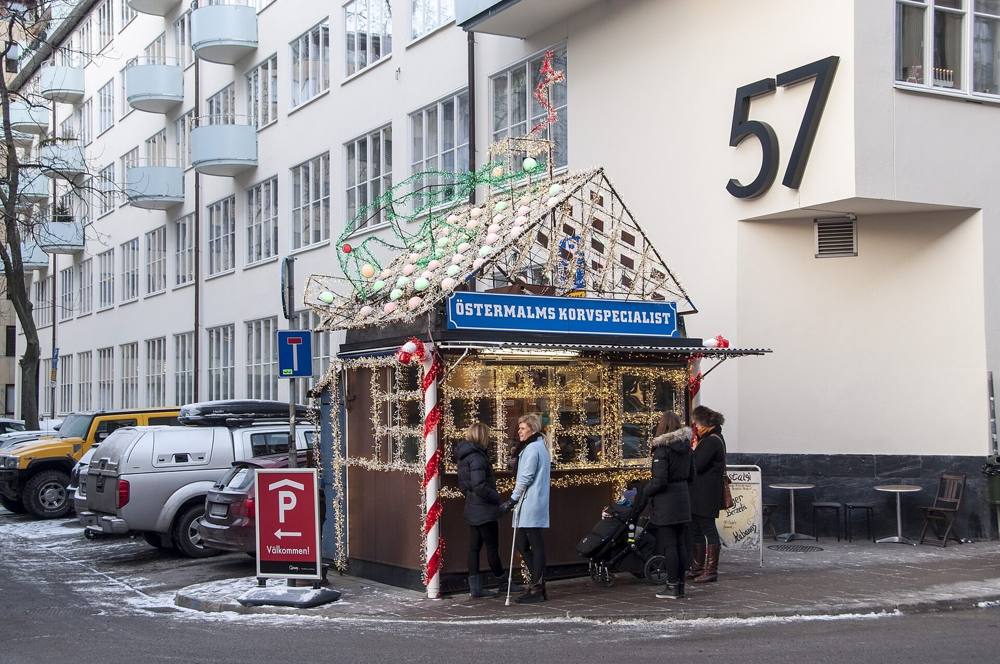
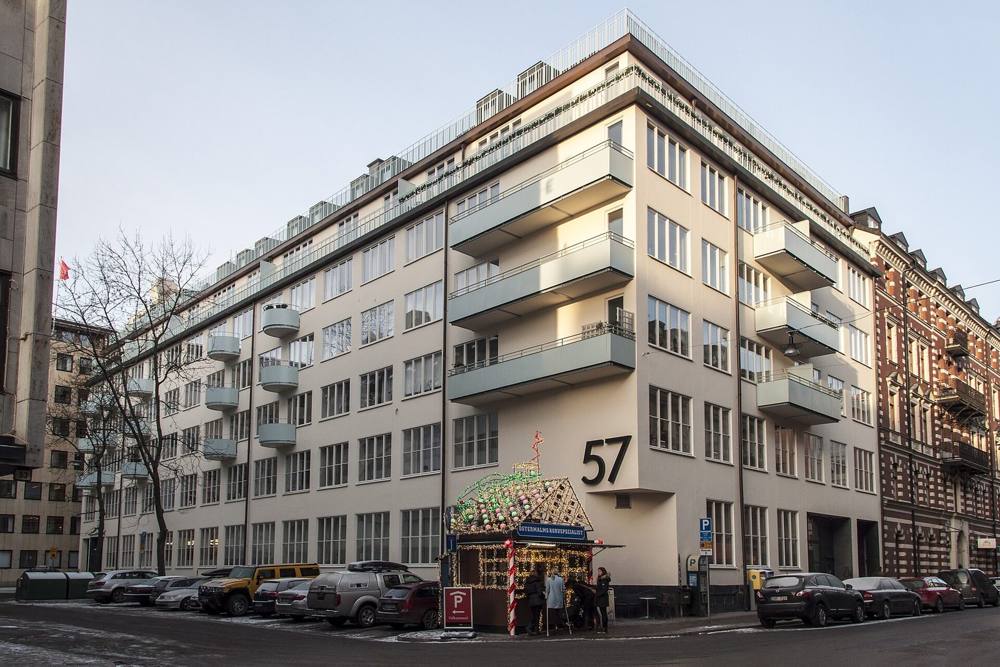
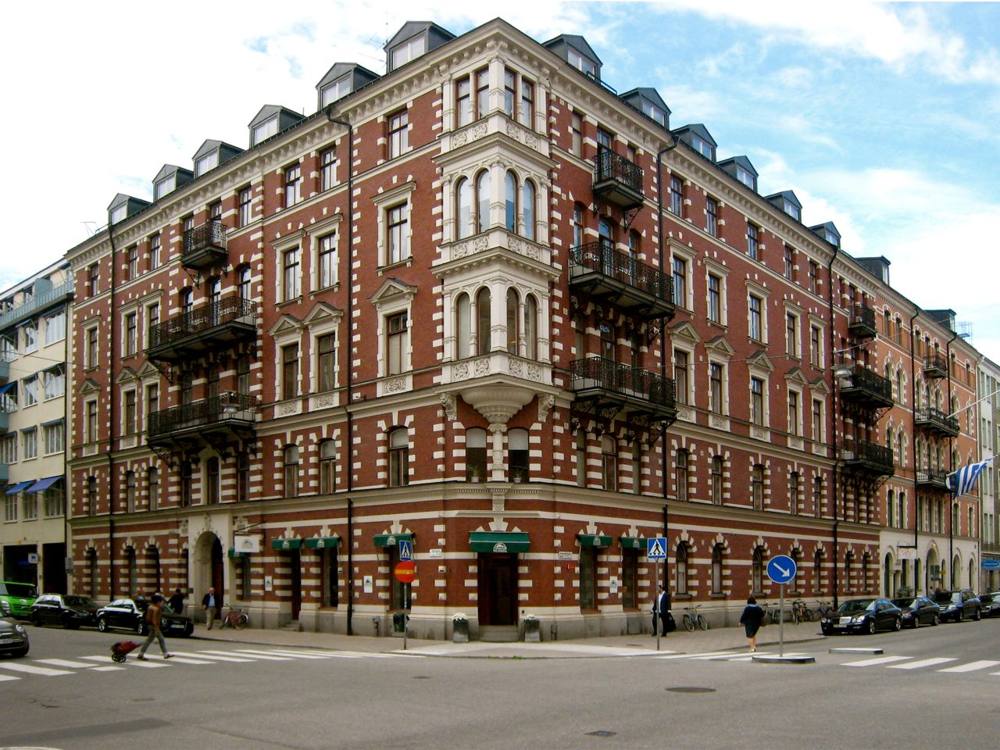
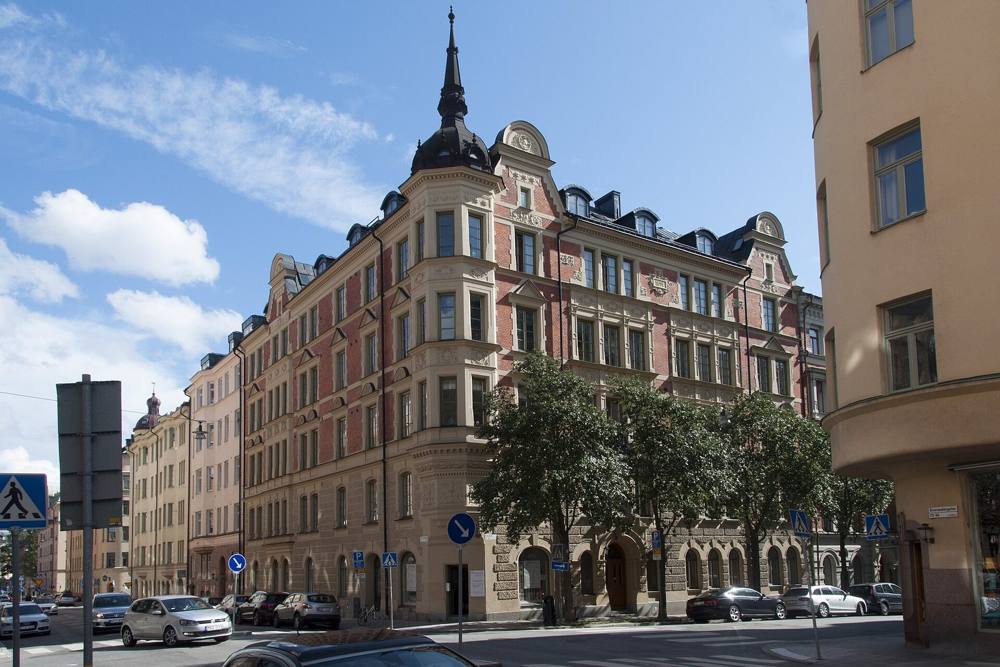
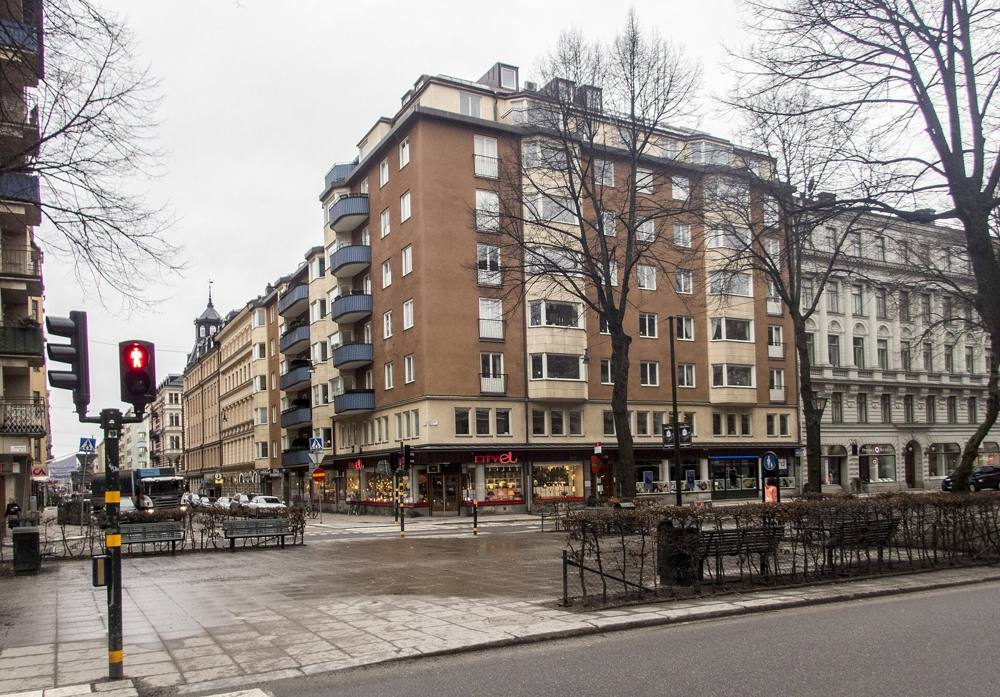
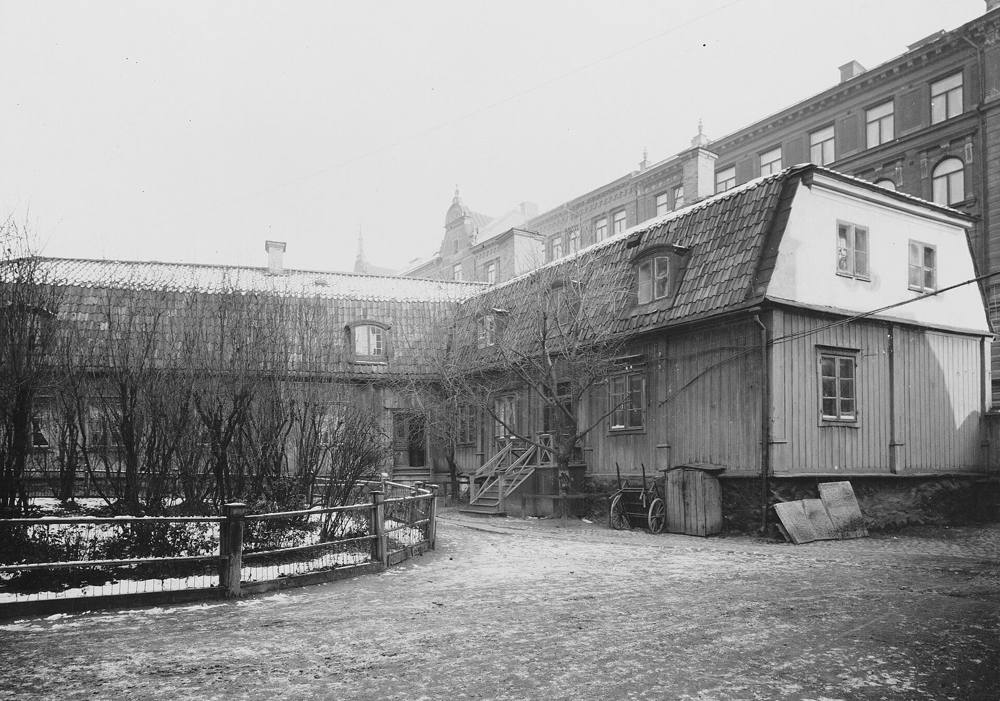
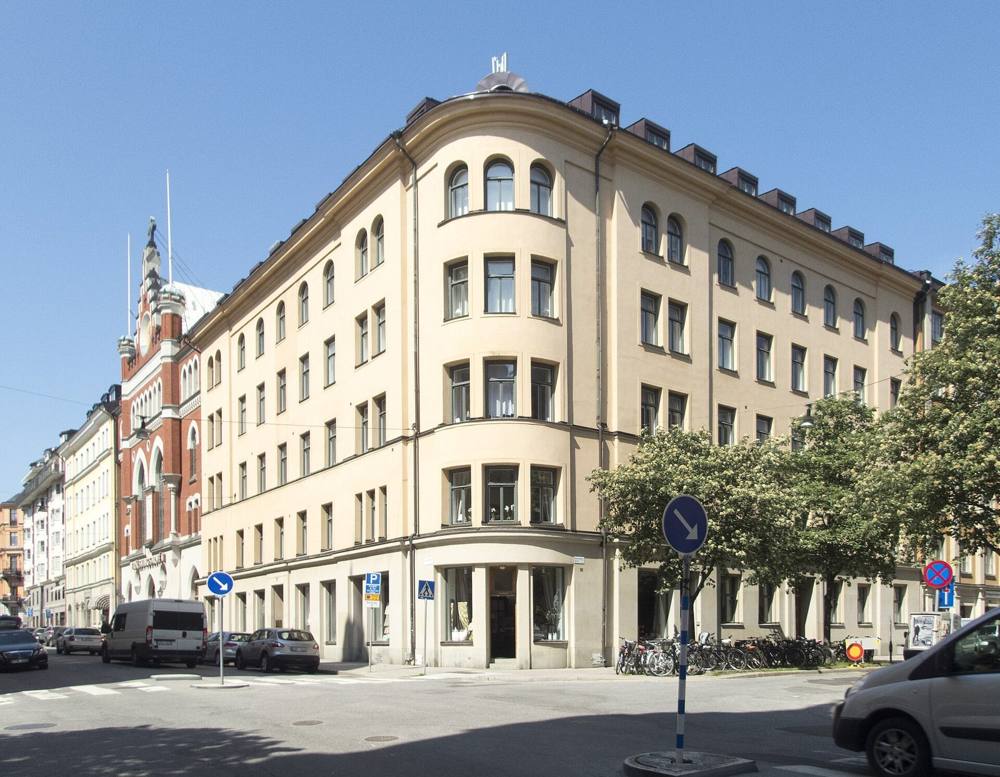
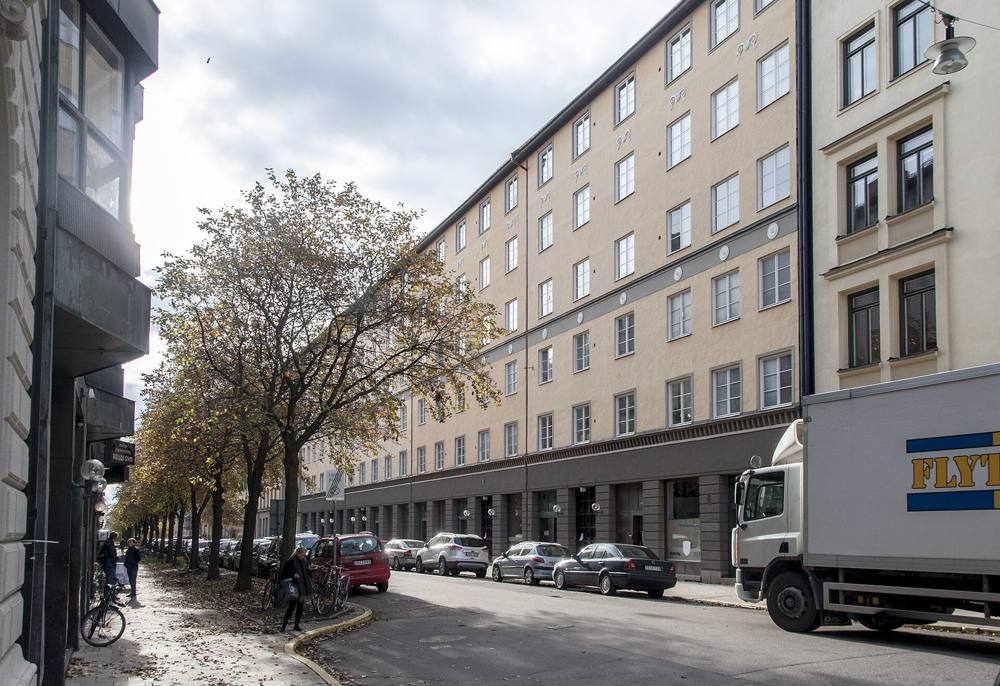
Of the 65 houses on Nybrogatan with an address, 30 are owned by housing associations (bostadsrättsföreningar), matched in Bolagsverket's register of 19 October 2026. For 4 of them the association's own annual report for 2025 gives the figures a buyer reads next to the asking price: the annual fee runs from 256 to 732 kr per m² a year, and the association's debt from 6,887 to 13,586 kr per m². For 35 houses no association was found: the sources do not say who owns them.
| House | Flats | Annual fee, kr per m² | Debt, kr per m² | Financial year | Land |
|---|---|---|---|---|---|
| No. 19–21Brf Riddaren 5 · Riddaren 5 | 49 | 732 | 13,586 | 2025 | Owned outright |
| No. 50Brf Forellen 15 · Forellen 15 | 94 | 256 | 6,887 | 2025 | Owned outright |
| No. 77Brf Rådjuret nr 20 · Rådjuret 20 | 33 | 712 | 7,053 | 2025 | Owned outright |
| No. 83–87HSB Bostadsrättsförening Bävern i Stockholm · Bävern 22 | 42 | 604 | – | 2025 | – |
| House | Annual fee, kr per m² | Debt, kr per m² | Year |
|---|---|---|---|
| No. 65–67Brf Flundran | 62 | – | 2023 |
| No. 65–67Brf Flundran | 62 | – | 2022 |
| No. 65–67Brf Flundran | 62 | – | 2021 |
| No. 65–67Brf Flundran | 62 | – | 2020 |
| No. 65–67Brf Flundran | 62 | – | 2019 |
| No. 65–67Brf Flundran | 62 | – | 2018 |
| No. 65–67Brf Flundran | 62 | – | 2017 |
| No. 65–67Brf Flundran | 62 | – | 2016 |
| No. 65–67Brf Flundran | 62 | – | 2015 |
| No. 65–67Brf Flundran | 62 | – | 2014 |
| No. 65–67Brf Flundran | 62 | – | 2013 |
| No. 65–67Brf Flundran | 62 | – | 2012 |
| No. 65–67Brf Flundran | 62 | – | 2011 |
| No. 65–67Brf Flundran | 62 | – | 2010 |
| No. 65–67Brf Flundran | 62 | – | 2009 |
| No. 65–67Brf Flundran | 62 | – | 2008 |
| No. 65–67Brf Flundran | 104 | – | 2007 |
| No. 75Brf Rådjuret 21 i Stockholm | 475 | – | 2024 |
| No. 75Brf Rådjuret 21 i Stockholm | 475 | – | 2023 |
| No. 75Brf Rådjuret 21 i Stockholm | 475 | – | 2022 |
| No. 75Brf Rådjuret 21 i Stockholm | 474 | – | 2021 |
| No. 75Brf Rådjuret 21 i Stockholm | 475 | – | 2020 |
| No. 75Brf Rådjuret 21 i Stockholm | 446 | – | 2019 |
| No. 75Brf Rådjuret 21 i Stockholm | 444 | – | 2018 |
| No. 75Brf Rådjuret 21 i Stockholm | 444 | – | 2017 |
| No. 75Brf Rådjuret 21 i Stockholm | 429 | 8 | 2016 |
| No. 75Brf Rådjuret 21 i Stockholm | 459 | 9,914 | 2015 |
| No. 75Brf Rådjuret 21 i Stockholm | 459 | 7,595 | 2014 |
| No. 75Brf Rådjuret 21 i Stockholm | 459 | 7,595 | 2013 |
| No. 75Brf Rådjuret 21 i Stockholm | 459 | 7,621 | 2012 |
| No. 75Brf Rådjuret 21 i Stockholm | 455 | 7,826 | 2011 |
| No. 75Brf Rådjuret 21 i Stockholm | 445 | 7,854 | 2010 |
| No. 75Brf Rådjuret 21 i Stockholm | 421 | 9,655 | 2009 |
| No. 75Brf Rådjuret 21 i Stockholm | 422 | 9,595 | 2008 |
| No. 75Brf Rådjuret 21 i Stockholm | 418 | – | 2007 |
Figures from each association's own annual report (årsredovisning), as linked from the estate agencies' listings or the association's own site. Only reports for 2025 or later count as current; older years are history and dated. Names and organisation numbers from Bolagsverket's register, 19 October 2026. «Matched by name»: the association's name is the property's designation, and no report or listing has confirmed the address yet. Tap a house for its own page.
The street set against Stockholm and the whole of Sweden. Each figure is for the finest area its publisher reports – the street's own four statistical areas, Östermalm or the district of Norra innerstaden – and says which. Nothing is modelled.
Share of homes, 2025 · The street's areas
14 percentage points above Stockholm
Share of homes, hyresrätt, 2025 · The street's areas
5.7 percentage points below Stockholm
Sales in the 12 months to September 2026 · Östermalm
40 % above Stockholm
July–September 2026 against 2025 · Östermalm
0.9 percentage points below Stockholm
1 January 2026 · Norra innerstaden
12 % above Stockholm
Average years queued for the existing flats let in 2025 · Norra innerstaden
69 % above Stockholm
Per 1,000 residents, 2025 · Norra innerstaden
34 % above Stockholm
Per 1,000 residents, 2023 – the last year Brå counted it alone · Östermalm
19 % below Stockholm
Per 1,000 residents, 2025 · Norra innerstaden
30 % below Stockholm
Share of residents, 2025 · The street's areas
9.3 percentage points above Stockholm
Share of households, 2025 · The street's areas
6.1 percentage points below Stockholm
Share of households, 2025 · The street's areas
4.6 percentage points above Stockholm
Share of residents aged 25–65, 2025 · The street's areas
3.3 percentage points above Stockholm
Löneinkomst per person 20+, SEK thousand a year, 2024 – the latest SCB publishes per area · The street's areas
30 % above Stockholm
Per person 20+, SEK thousand a year, 2024 – the latest SCB publishes per area · The street's areas
7.7 times Stockholm's
SEK thousand a month, people 20+, capital income not included – SCB's preliminary monthly figures, not published per area · Stockholm
Not published for the street's areas.
January–June 2026, as above · Stockholm
Not published for the street's areas.
In traffic, registered to residents, per 1,000 residents, 2025 · The street's areas
9 % above Stockholm
The street's areas: Statistics Sweden's DeSO 0180C4340, 0180C4430, 0180C4690 and 0180C4750 together, 5,328 residents – in SCB's areas Hedvig Eleonora. Incomes are means, so a few very large incomes pull them up; capital income includes gains on sales of shares and property. Sources: Statistics Sweden (read 2026-10-20), Svensk Mäklarstatistik, Bostadsförmedlingen, Brå.
Six homes in ten here are bostadsrätter – you buy a share in the association that owns the building, and pay it a monthly fee. The rest are rented, through the city's queue or second hand.
Up 7.0 % in a year. Prices per m², July–September 2026:
Svensk Mäklarstatistik, bostadsrätter, updated 8 October 2026. Averages; the source publishes no medians. Source
160,563 kr per m² is the median asking price across the 40 bostadsrätter for sale in Östermalm with a price and a size; half ask between 144,811 and 184,721 kr. The median flat asks SEK 15.4m, with a monthly fee of 4,317 kr. VERA PI's read of the estate agencies' own adverts, 20 October 2026 – asking prices, not sales; no single-street figure until the street has adverts of its own.
The county's median bostadsrätt sold for 5.2 times as much in 2025 as in 2000 – SEK 3.5m against SEK 0.68m.
Median sale price of a bostadsrätt, SEK thousand – Stockholm county, the finest level Statistics Sweden publishes; not the street. SCB, BO0501C.
About 16,600 kr a month for 100 m² at the median. Stockholm as a whole: 1,772 kr per m².
Rent here runs 12 % above the city: 1,993 kr per m² a year in Norra innerstaden in 2026, against 1,772 kr for Stockholm and 1,483 kr for Sweden.
Median rent per m² a year. Statistics Sweden reported Östermalm on its own until 2023; from 2024 it reports Norra innerstaden, the new district of Östermalm and Norrmalm – hence the dashed line. Hover or tap a point for the figure; on a keyboard, tab to the chart and use the arrow keys.
Bostadsförmedlingen i Stockholm, statistics for 2025. Source
Since 2024 Brå counts Östermalm together with Norrmalm and the city centre as Norra innerstaden – 34 % more reported crime per resident than Stockholm in 2025. Östermalm on its own, last counted in 2023, was 19 % below the city.
Share of residents who feel unsafe, or stay in, when out alone late at night in their own area, 2026 – Stockholms stad's survey, which reports Norra innerstaden as a whole; it does not say which streets fall in its smaller areas.
Östermalm's rate fell 19 % from 2015 to 2023; Norra innerstaden, which takes in the city centre, ran 34 % above Stockholm in 2025.
Reported crimes per 1,000 residents. Brå counted Östermalm on its own until 2023; from 2024 it reports Norra innerstaden, which also takes in the city centre on Norrmalm.
Per 1,000 residents
29 % below Stockholm
41 % below Stockholm
16 % below Stockholm
16 % above Stockholm
34 % below Stockholm
22 % below Stockholm
4 % below Stockholm
Brå: reported crime is not all crime – not every crime comes to the police's attention. Local figures go by where the crime happened and are set against the people who live there. Our note: a district full of theatres, restaurants, shops and stations can therefore show a high rate against few residents. In 2025, 12 % of reports in the Stockholm police region had no recorded municipality. Sources: Brå, reported offences; Stockholms stad, Trygghetsmätning 2026 (source).
5,328 people live in the street's four areas. 47 % of them are over fifty (Stockholm: 35 %), 21 % of the households have children, and of those aged 25–65, 50 % hold a university degree of three years or more (Stockholm: 47 %).
26 % of the residents here are 65 or over – against 17 % across Stockholm; the street's areas have fewer people aged 20–49.
Share of residents in each age group, 2025. Statistics Sweden.
Mean net income in the street's areas was SEK 1,207k a year per person aged 20 and over in 2024, up from 1,141k in 2019 – Stockholm: 468k in 2024.
Walking times along the street network from the nearest point of Nybrogatan, at 80 metres a minute.
Stations: SL and Trafiklab; the walk is measured along OpenStreetMap's paths and pavements, so it is never shorter than the straight line. Schools: Skolverket's school-unit register.
Streets next door: SibyllegatanMajorsgatanGrev TuregatanKommendörsgatanÖstermalmstorgKarlavägenCardellgatanArtillerigatan
The nearest care and everyday places from Nybrogatan, nearest first, with the way there in Google Maps or Apple Maps. Emergency care is shown however far it is; everything else within 2 km.
In an emergency, call 112Medical advice day and night: 1177
Sjukhusbacken 12 · 2.8 km
Open 24/7 · 08-123 621 20
Tideliusgatan 14 · 2.6 km
Hjalmar Cederströms gata 14 · 2.9 km
Open 24/7 · 08-123 642 66
Karlavägen 56 · 75 m
313 m
87 m
Värtavägen 23 · 733 m
Klarabergsviadukten 49 · 1.1 km
Distance in a straight line from the nearest point of the street; the walk is estimated at 1.3 times that, at 80 metres a minute. Source: © OpenStreetMap contributors (ODbL), emergency and urgent care and health centres checked against 1177, police stations against Polisen, read 20 October 2026.
Metro Mode's Stockholm guides from 2025 and 2026, read address by address. On the street and around the corner, with the guide each tip comes from.
The brasserie where the Caesar salad is made at the table and the tournedos flambéed, with a weekend brunch off the à la carte – in our 2026 restaurant and brunch guides and the 2025 lists.
Restaurants in Stockholm – 8 addresses for your next dinner, 2026In 4 Metro Mode guidesA New York-style deli and wine bar – charcuterie, cheese and proper sandwiches; on three of our 2025 lists: trendiest restaurants, trendy wine bars and cosy restaurants.
25 trendiest restaurants in Stockholm right now, 2025In 3 Metro Mode guidesA boutique hotel of seventy rooms and suites next door to Östermalms saluhall – in our 2026 hotel guide and among the dog-friendly hotels.
Hotels in Stockholm – 8 addresses for a weekend in style, 2026In 2 Metro Mode guidesA lively neighbourhood bistro for breakfast, lunch and dinner – steak tartare, prawn sandwiches and pancakes; on our 2025 brunch and cosy-restaurant lists.
20 best brunches in Stockholm, 2025In 2 Metro Mode guidesThe national stage at Nybroplan, with several stages – Lilla scenen's entrance is on Almlöfsgatan; in our 2026 stage, cinema and concerts guide.
Stage, cinema and concerts in Stockholm – six evenings to plan around, 2026International furniture and lighting design – the place to try the sofa before a bigger purchase; in our 2026 interiors guide.
Interiors shops in Stockholm – 8 addresses for a more personal home, 2026The fish restaurant inside Östermalms saluhall, with its own evening entrance at Nybrogatan 31 once the hall has closed – in our 2026 fish and seafood guide.
Fish and seafood in Stockholm – from oysters to fried cod, 2026Several specialists under one roof – Lisa Elmqvist for fish, B. Andersson for poultry and game, Arla Unika for cheese; in our 2026 delicatessen guide.
Delis and market halls in Stockholm – five addresses for dinner at home, 2026Second-hand with a contemporary wardrobe in mind – clothes to wear now; in our 2026 vintage guide.
Vintage and second-hand in Stockholm – 8 addresses for your next find, 2026French brasserie tradition with Swedish touches – biff Rydberg in the dining room, Lilla Baren for another kind of evening; in our 2026 restaurant guide and the 2025 trendiest list.
Restaurants in Stockholm – 8 addresses for your next dinner, 2026In 2 Metro Mode guidesFoil highlights and toning as treatments of their own, for keeping a blonde tone even – in our 2026 colour guide.
Colour and highlights in Stockholm – six addresses for bleaching, balayage and grey coverage, 2026Furniture and rugs in a pared-back style, built around its own collection – in our 2026 interiors guide.
Interiors shops in Stockholm – 8 addresses for a more personal home, 2026Neapolitan pizza with no bookings – walk in and take a table when one is free; one of three addresses in our 2026 restaurant guide.
Restaurants in Stockholm – 8 addresses for your next dinner, 2026A gallery of 20th-century Nordic design – furniture, lighting, glass and ceramics, with staff who know each piece's story; in our 2026 interiors guide.
Interiors shops in Stockholm – 8 addresses for a more personal home, 2026The all-day restaurant at the head of the street, looking out over the water – on our 2025 lists of the trendiest restaurants and the best brunches.
25 trendiest restaurants in Stockholm right now, 2025In 2 Metro Mode guidesSL's commuter boat 80 to Nacka strand and Blockhusudden – an outing for the price of an SL card, on our 2026 list.
16 hidden gems you can reach with an SL card, 2026A family-run trattoria with roots in Marche – carbonara, vongole and a table you can book; in our 2026 Italian and neighbourhood guides and on the 2025 cosy list.
Italian in Stockholm – pizza, pasta and trattorias to return to, 2026In 3 Metro Mode guidesThe general election of 13 September 2026, final result, in the 8 voting districts Nybrogatan runs through, the largest share of the street first. The figures are each whole district's, not just the street's.
The districtStockholms kommun
| Party | Stockholm | County | Sweden |
|---|---|---|---|
| Moderates | 19.1 % | 21.8 % | 19.9 % |
| Centre Party | 9.8 % | 8.6 % | 7.0 % |
| Liberals | 7.1 % | 6.8 % | 5.3 % |
| Christian Democrats | 3.9 % | 4.9 % | 6.2 % |
| Social Democrats | 26.3 % | 26.0 % | 28.0 % |
| Left Party | 13.0 % | 10.2 % | 8.4 % |
| Green Party | 11.1 % | 8.0 % | 6.1 % |
| Sweden Democrats | 8.4 % | 12.1 % | 17.5 % |
| Other parties | 1.2 % | 1.4 % | 1.6 % |
| Turnout | 85.8 % | 84.7 % | 84.9 % |
Share of valid votes in each district. The tick on each bar is Stockholms kommun. Change since 2022 in percentage points. Early votes that arrived late are counted in the municipality's collection district and are in no district's shares. The election is not part of the VERA PI Score. Source: Valmyndigheten, final result, published 7 October 2026. Valmyndigheten's data
Two cards for Nybrogatan: the street in figures, and its VERA PI Score. Share one and the link arrives with that card as its picture; save it for Instagram. Every house on the street has its own card too.
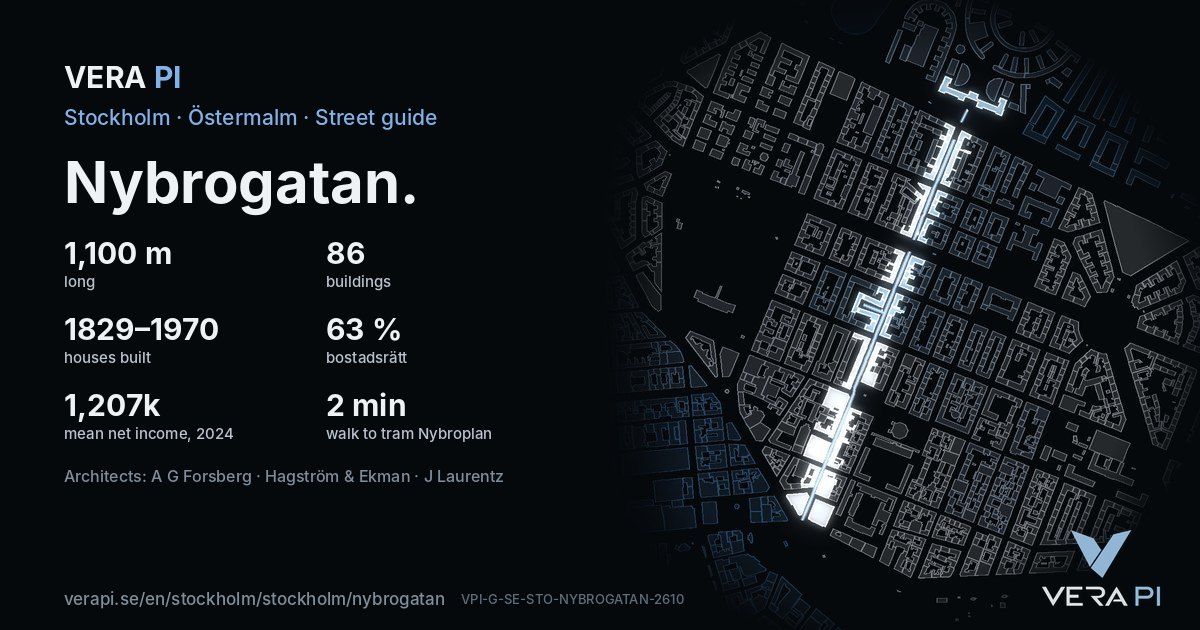
Buildings and heights: building outlines © OpenStreetMap contributors, ODbL 1.0 (Geofabrik's Sweden extract, read 20 October 2026); heights, property designations and use from Stockholms stad's 3D-byggnader LOD1, open data.
The houses: Stadsmuseet i Stockholm, Byggnadsinventering Östermalm I (1974), Östermalm II (1985), Östermalm III (1986) and Östermalm IV (1984), via Stockholmskällan – year built (building permit to final inspection), architect, client, master builder and facade, each read three times from the scanned page and linked to that page. Facades and later changes are quoted in the inventory's Swedish.
Names and heritage classes: Swedish Wikipedia (CC BY-SA 4.0) – article tables and categories – and Wikidata (CC0), read 20 October 2026.
Housing associations: Bolagsverket's open register (värdefulla datamängder), 19 October 2026, for names and organisation numbers; fees, debt and flats from each association's own annual report, as linked from estate agencies' listings or the association's site – figures for 2025 or later are current, older ones are history.
People, homes, income, education, cars and rents: Statistics Sweden (SCB), CC BY 4.0 – DeSO tables for 2025 (population, households, tenure, education, cars) and 2024 (income, the latest per area), the preliminary monthly income statistics HE0110M for 2025–2026, rents by district (BO0406) and the county's bostadsrätt prices (BO0501C); read 2026-10-20.
Prices: Svensk Mäklarstatistik, bostadsrätter, updated 8 October 2026. Asking prices: VERA PI's read of the estate agencies' own adverts, 20 October 2026 – asking prices, not sales; no Hemnet, no Booli. Rental queue: Bostadsförmedlingen i Stockholm, 2025.
Crime and safety: Brottsförebyggande rådet (Brå), reported offences 2015–2025; Stockholms stad, Trygghetsmätning 2026, Norra innerstaden.
Getting around: SL and Trafiklab stops; walks along OpenStreetMap's network. Schools: Skolverket, school unit register. Parks: OpenStreetMap.
The VERA PI Score: VERA PI's own ranking of Stockholm stad's 4,346 streets, version 1 – not a price and not a valuation.
Photographs: Wikimedia Commons, each under the licence named in its caption.