Sweden › Stockholm › Järfälla · kommun · area statistics
What homes cost in Järfälla.
A house sold for SEK 5,573,000 on average in 2025 – +1.8% in a year and +22.5% in ten, in 376 sales. 90,180 people live here, with a mean net income of SEK 357k. It ranks 16 of the län’s 26 kommuner by house price.
Official statistics of Statistics Sweden: house sales since 1981, rents, people, incomes and dwellings. VERA PI shows no individual sale in Sweden – why, below.
Prices
What homes sell for.
A house in Järfälla sold for SEK 5,573,000 on average in 2025 – +1.8% in a year and +22.5% in ten – in 376 sales; it ranks 16 of the län’s 26 kommuner by house price. SCB publishes the prices of bostadsrätter by län, not by kommun: Stockholms län’s median was SEK 3,500,000 in 2025.
Houses sold in Järfälla, a year
The mean price of permanent småhus (freehold, not site-leasehold), 1981 – 2025. A mean, not a mix-adjusted index: a year of larger houses moves it.
- Järfälla
- Stockholms län
Sales of småhus by kommun (BO0501), Source: Statistics Sweden, CC BY 4.0.
- Järfälla
- Stockholms län
Sales of småhus by kommun (BO0501), Source: Statistics Sweden, CC BY 4.0.
People and homes
Järfälla, counted.
90,180 people lived here at the end of 2025 – +24.5% since 2015 – in 38,959 households and 40,635 dwellings. The mean net income of the people aged 20 and over was SEK 357k a year in 2024 – −19.3% against Stockholms län.
How the dwellings are held, 2025
Dwellings by tenure (upplåtelseform).
- Bostadsrätt (tenant-owned)41% · 16,757
- Hyresrätt (rented)34% · 13,847
- Äganderätt (owner-occupied)25% · 10,031
By building
| Building | Dwellings | Bostadsrätt | Rented | Owned |
|---|---|---|---|---|
| Blocks of flats | 27,575 | 55% | 43% | 2% |
| Houses (småhus) | 11,489 | 13% | 4% | 83% |
| Special housing | 1,331 | 4% | 96% | 0% |
| Other buildings | 240 | 34% | 66% | 0% |
When the homes were built
Dwellings by build period, 2025.
Households, 2025
Population (BE0101), households (BE0101), net income (HE0110, people aged 20 and over, mean, 2024 prices), dwellings by tenure and build period (BO0104) – Source: Statistics Sweden, CC BY 4.0. Summed over 44 DeSO areas (2025).
Rents
What a rented home costs.
The median rent of a rented flat (hyresrätt) in Järfälla was SEK 1,614 per square metre a year in 2026 (+6.0% in a year) – about SEK 9,420 a month for 70 m². Swedish rents are set by negotiation (bruksvärde), not by the market.
Median rent per m², a year
- Järfälla
- Stockholms län
Rents in rented dwellings (BO0406), median annual rent per m², Source: Statistics Sweden, CC BY 4.0.
- Järfälla
- Stockholms län
Rents in rented dwellings (BO0406), median annual rent per m², Source: Statistics Sweden, CC BY 4.0.
Schools and getting around
Schools, stations and parks.
28 active school units in Järfälla – 25 with compulsory school, 3 with upper secondary – and 3 metro, rail, tram and ferry stops.
Stations and stops
- Pendeltåg and railBarkarby · Jakobsberg · Kallhäll
The largest parks
- Görvälns naturreservat921.6 ha
- Västra Järvafältet608.8 ha
- Görvälns naturvårdsområde194 ha
- Molnsättra62.9 ha
- Norra Igelbäcken38.1 ha
- Kyrkparken4 ha
School units
Active units in Skolverket’s register.
- Aspnässkolancompulsory, pre-school class
- Barkarbyskolancompulsory, pre-school class
- Berghemskolancompulsory, pre-school class
- Björkebyskolancompulsory
- Drottning Blankas Gymnasieskola Jakobsbergupper secondary
- Fastebolskolancompulsory, pre-school class
- Fjällenskolancompulsory, pre-school class
- Herrestaskolancompulsory, pre-school class
- Högbyskolancompulsory
- Iljansbodaskolancompulsory, pre-school class
- Internationella Engelska Skolan Järfällacompulsory
- Järfälla gymnasium Barkarbyupper secondary
- Järfälla gymnasium Jakobsbergupper secondary
- Kolarängskolancompulsory, pre-school class
- Kvarnskolancompulsory
- Källtorpskolancompulsory
- Lundskolancompulsory, pre-school class
- Montessoriskolan Växthusetcompulsory, pre-school class
- Neptuniskolancompulsory, pre-school class
- Olovslundskolancompulsory, pre-school class
- Sandvikskolancompulsory, pre-school class
- Skälbyskolancompulsory, pre-school class
- Tallbohovskolancompulsory, pre-school class
- Ulvsättraskolancompulsory, pre-school class
- Vattmyraskolancompulsory, pre-school class
- Viksjöskolancompulsory
- Vittra Jakobsbergcompulsory, pre-school class
- Ålstaskolancompulsory, pre-school class
School units: Skolverket’s school-unit register and planned-educations API (open data). Stations and parks: © OpenStreetMap contributors, ODbL 1.0 – a stop is counted where it lies inside the boundary.
Kommuner
Among the län’s 26 kommuner.
The mean price of the houses sold in 2025, its change over one and ten years, the number sold, the mean net income, and the house price since 2005. Each kommun opens on its own page.
| Kommun | House, mean | 1 yr | 10 yrs | Sold | Net income | 2005 – |
|---|---|---|---|---|---|---|
| Danderyd32,500 people · 37% bostadsrätt | SEK 13.81m | +5.5% | +35.7% | 168 | SEK 1,048k | |
| Lidingö48,369 people · 38% bostadsrätt | SEK 13.14m | +1.6% | +40.9% | 252 | SEK 709k | |
| Solna86,435 people · 63% bostadsrätt | SEK 10.85m | −1.6% | +17.0% | 28 | SEK 414k | |
| Nacka113,730 people · 50% bostadsrätt | SEK 10.07m | +7.2% | +42.0% | 579 | SEK 541k | |
| Sundbyberg57,000 people · 47% bostadsrätt | SEK 10.04m | +3.6% | +46.9% | 58 | SEK 384k | |
| Stockholm stad999,239 people · 49% bostadsrätt | SEK 8.85m | +2.9% | +33.9% | 1,380 | SEK 468k | |
| Täby78,514 people · 47% bostadsrätt | SEK 8.83m | +2.9% | +42.1% | 562 | SEK 537k | |
| Vaxholm11,636 people · 39% bostadsrätt | SEK 8.24m | −4.1% | +36.3% | 102 | SEK 543k | |
| Sollentuna78,033 people · 38% bostadsrätt | SEK 8.05m | +0.6% | +29.8% | 429 | SEK 459k | |
| Tyresö49,645 people · 30% bostadsrätt | SEK 6.63m | +4.9% | +37.1% | 340 | SEK 421k | |
| Värmdö46,601 people · 25% bostadsrätt | SEK 6.59m | +6.0% | +49.0% | 453 | SEK 454k | |
| Ekerö29,062 people · 14% bostadsrätt | SEK 6.54m | +3.0% | +46.7% | 320 | SEK 500k | |
| Huddinge114,686 people · 31% bostadsrätt | SEK 6.5m | +3.5% | +36.4% | 711 | SEK 376k | |
| Österåker49,943 people · 22% bostadsrätt | SEK 5.67m | +0.1% | +56.3% | 525 | SEK 460k | |
| Vallentuna35,361 people · 33% bostadsrätt | SEK 5.57m | +5.4% | +49.3% | 315 | SEK 418k | |
| Järfälla90,180 people · 41% bostadsrätt | SEK 5.57m | +1.8% | +22.5% | 376 | SEK 357k | |
| Salem17,370 people · 32% bostadsrätt | SEK 5.47m | +0.9% | +32.9% | 84 | SEK 388k | |
| Upplands Väsby50,495 people · 36% bostadsrätt | SEK 5.4m | +2.6% | +27.4% | 183 | SEK 356k | |
| Sigtuna53,365 people · 29% bostadsrätt | SEK 5.39m | +0.6% | +36.9% | 259 | SEK 334k | |
| Haninge101,408 people · 35% bostadsrätt | SEK 5.07m | +3.2% | +31.0% | 520 | SEK 345k | |
| Upplands-Bro33,333 people · 30% bostadsrätt | SEK 4.82m | +3.8% | +36.4% | 180 | SEK 350k | |
| Botkyrka96,750 people · 25% bostadsrätt | SEK 4.79m | −1.8% | +27.9% | 371 | SEK 310k | |
| Nykvarn12,384 people · 15% bostadsrätt | SEK 4.56m | +2.6% | +51.7% | 104 | SEK 401k | |
| Södertälje102,772 people · 23% bostadsrätt | SEK 4.32m | +3.5% | +42.2% | 371 | SEK 314k | |
| Nynäshamn30,610 people · 22% bostadsrätt | SEK 4.18m | +4.9% | +50.1% | 203 | SEK 340k | |
| Norrtälje66,832 people · 25% bostadsrätt | SEK 3.57m | +2.0% | +57.8% | 559 | SEK 352k |
Sales of småhus by kommun (BO0501), net income (HE0110), dwellings by tenure (BO0104) – Source: Statistics Sweden, CC BY 4.0.
Streets
Street by street.
769 streets in Järfälla – each with its own page and share card: the buildings along it, the area around it, the walk to the nearest station and the schools near it. The small figure is the number of buildings along the street. No street has a price – SCB publishes prices by kommun only.
A40 streets
- Abborrvägen19
- Adilsvägen3
- Adjunktsvägen7
- Af Ugglas väg27
- Aftonvägen16
- Agrargränd4
- Agrarvägen4
- Agronomgränd5
- Akvarellgränd14
- Allmogevägen4
- Allmänningsvägen23
- Almarevägen25
- Almvägen13
- Alprosvägen34
- Alpvägen6
- Alvägen9
- Amunds väg6
- Ananasvägen59
- Andebodavägen79
- Aniaravägen21
- Anton Johanssons väg10
- Apelsinvägen49
- Apollovägen43
- Aprikosgränd5
- Aprilvägen48
- Arealvägen28
- Arlavägen30
- Aron Lindgrens väg6
- Arrendevägen
- Askungevägen1
- Aspnäsrondellen1
- Aspnäsvägen7
- Aspvägen17
- Astrakangränd2
- Astronomivägen12
- Attackvägen3
- Augustivägen4
- Avstyckningsgränd8
- Avstyckningsvägen71
- Axvägen5
B74 streets
- Backvägen31
- Baldersvägen3
- Banangränd3
- Bancovägen16
- Bandyvägen33
- Banjogränd2
- Banmästargatan2
- Banvaktsgatan1
- Banvägen65
- Barkarby Torg4
- Barkarbyvägen53
- Barsbro Torg4
- Barsbrovägen30
- Barytongränd49
- Basetvägen3
- Basfiolgränd2
- Basketvägen2
- Basunvägen22
- Belevägen22
- Bellisvägen9
- Berghemsvägen109
- Bergsringen53
- Betselvägen27
- Bielkenstiernas väg13
- Bifrostvägen10
- Birger Dahlerus väg8
- Birgittarondellen
- Birgittavägen18
- Birkagränd20
- Biskop Brasks gränd21
- Biskop Henriks väg27
- Biskop Johannes väg27
- Biskop Jöns väg18
- Biskop Magni väg6
- Biskop Nils väg33
- Biskop Olovs väg30
- Biskop Ragvaldi väg20
- Biskop Tords väg6
- Björkebyvägen38
- Björkvägen8
- Björnstiernas väg44
- Blixtvägen76
- Blockvägen12
- Blomstervägen12
- Blyvägen20
- Blåeldsvägen23
- Blåklintsvägen7
- Blästervägen1
- Bockgränd4
- Bodaängsvägen39
- Bolindertunneln
- Bolindervägen111
- Bondegränd4
- Bondevägen24
- Bonäsvägen19
- Botanikvägen12
- Brageslingan13
- Brantvägen19
- Brasvägen3
- Braxengränd10
- Bronsvägen14
- Brukargränd14
- Bruttovägen24
- Brynjevägen62
- Bråvallagränd23
- Bråvallavägen17
- Brännbolsvägen7
- Budkavlevägen19
- Byleden1
- Bågspännarvägen34
- Bäckparksgatan1
- Bällstaågatan3
- Bältevägen10
- Bärnstensvägen17
C8 streets
D25 streets
- Dackevägen14
- Dadelgränd12
- Daggvägen19
- Dalgången23
- Danagränd18
- Datavägen11
- Debetvägen
- Decembervägen21
- Diakonvägen10
- Dikartorpsvägen11
- Diligensgatan1
- Dimvägen44
- Diskusgränd11
- Domarstigen9
- Drabantvägen4
- Dragonbacksrondellen1
- Dragonvägen20
- Dragspelsvägen18
- Drakengatan12
- Drakvägen15
- Dressyrvägen19
- Droskvägen1
- Dukatvägen18
- Dvärgvägen14
- Däckelvägen38
E15 streets
F41 streets
- Fabelvägen2
- Fabian Wredes gränd9
- Fabriksvägen10
- Fagottgränd10
- Fakturavägen5
- Fallskärmsvägen34
- Fanjunkarvägen20
- Fasanvägen9
- Fastebolsrondellen
- Fastebolvägen13
- Februarivägen24
- Ferievägen43
- Filarvägen4
- Fiskargränd11
- Flintvägen27
- Flintvägen 3b7
- Flottiljrondellen1
- Flottiljvägen12
- Flygarvägen52
- Flygfältsvägen7
- Flyginfarten19
- Flöjtgränd12
- Folkhögskolevägen2
- Folkungavägen20
- Forellgränd6
- Fornvägen50
- Fotbollvägen5
- Friggaslingan8
- Frihetsgränd4
- Frihetsvägen18
- Fullblodsvägen20
- Furirgränd13
- Fuxvägen21
- Fyndvägen17
- Fyrspannsvägen11
- Fysikvägen23
- Fågelvägen47
- Fäbodvägen21
- Fänriksvägen18
- Färggränd1
- Fölvägen45
G31 streets
- Galaxgränd40
- Galgbacken2
- Galgbacksrondellen
- Galoppvägen71
- Generalsgatan4
- Generatorvägen10
- Geografivägen16
- Getgränd3
- Girovägen5
- Gitarrvägen35
- Gjutarplan4
- Gjutmästare Rosbergs väg10
- Godsvägen6
- Gokartvägen5
- Golfvägen6
- Grimvägen13
- Gripengatan20
- Gryningsvägen10
- Gränsvägen48
- Grönstensvägen13
- Grönvretsvägen32
- Gullivervägen5
- Gustav Trolles väg35
- Gyllenstiernas väg21
- Gymnastikvägen34
- Gårdsvägen37
- Gäddvägen41
- Gärdesvägen11
- Gökvägen21
- Görvälnsvägen1
- Gösvägen27
H40 streets
- Hagelvägen13
- Hagvägen22
- Hammarvägen18
- Handbollvägen13
- Handformarvägen2
- Handkvarnsgränd5
- Hangarvägen8
- Hanna Nilssons väg15
- Harpungränd15
- Hasselnötsvägen22
- Havrevägen22
- Hedebyslingan36
- Helikoptervägen3
- Hemmansvägen39
- Henry Bergstens väg5
- Heravägen7
- Herculesgatan23
- Herculesgatan (Barkarby östra-Veddesta)
- Herrestarondellen2
- Herrestavägen16
- Hindervägen13
- Historievägen18
- Hjälmvägen32
- Horsgärdesvägen11
- Hovvägen43
- Hubert Laurins väg7
- Hummelmoravägen37
- Hummergränd9
- Hummervägen5
- Husargränd1
- Hårstarondellen
- Häcklöpargränd4
- Häggvägen41
- Hällvägen26
- Häradsvägen20
- Hästskovägen40
- Hättkvarnsgatan10
- Högbyvägen48
- Höjdvägen12
- Höstvägen14
I4 streets
J12 streets
K61 streets
- Kadettgränd11
- Kalendervägen16
- Kallhällsleden23
- Kalvgränd9
- Kalvshällavägen11
- Kaminvägen1
- Kanotvägen16
- Kantorvägen5
- Kaplanvägen6
- Kaprifolvägen18
- Kaptensvägen13
- Karlavagnsgränd30
- Karlslundsvägen24
- Kartvägen46
- Kassavägen1
- Kastanjevägen24
- Katrinedalsvägen
- Kattfotsvägen14
- Kikarvägen21
- Killinggränd11
- Klarinettgränd11
- Klavergränd3
- Klintvägen19
- Klockarvägen6
- Klövervägen20
- Knallevägen31
- Knektbacken10
- Knektvägen25
- Kolartorpsvägen11
- Kolarängsvägen3
- Kolbodavägen8
- Kometvägen25
- Kontovägen4
- Kopparvägen11
- Korintgränd12
- Kornvägen21
- Korpralsvägen22
- Kosmosgränd44
- Kristinavägen9
- Kristoffer Huldts väg14
- Krokivägen10
- Krokusvägen17
- Kronvägen73
- Kråkbärsgränd4
- Kräftvägen8
- Kulingvägen16
- Kullevägen31
- Kulstötargränd18
- Kulörgränd11
- Kvarnbacksrondellen3
- Kvarnvingevägen1
- Kvarnvägen5
- Kvartalsvägen5
- Kyrkoherdevägen8
- Kyrkoplan1
- Kyrkvägen25
- Källtorpsvägen22
- Kämpevägen26
- Kärnmakargränd3
- Kärrbodavägen25
- Kärrvägen80
L25 streets
- Lagfartsvägen4
- Lagmansvägen11
- Landågatan4
- Landåstråket5
- Lansengatan10
- Lantmäterivägen15
- Ledungsgränd18
- Legendvägen2
- Lidvägen58
- Lilla Björnens gränd5
- Lilla Hundens gränd10
- Linsvägen18
- Ljungbackavägen26
- Ljustergränd26
- Lunavägen4
- Lundavägen26
- Lyravägen17
- Långskeppsvägen12
- Lädersättravägen27
- Lärkvägen15
- Läxvägen20
- Löjtnantsgränd30
- Löjtnantsvägen5
- Lövhagsvägen26
- Lövholmsvägen3
M44 streets
- Magnusvägen2
- Majorsvägen24
- Majvägen14
- Malmvägen8
- Malstensgränd7
- Mandelgränd70
- Mandolinvägen20
- Mantalsvägen34
- Margaretavägen9
- Marhagsvägen1
- Markervägen19
- Markgränd16
- Marsvägen32
- Maskinistvägen5
- Mejerivägen1
- Melongränd4
- Merkuriusvägen20
- Metallvägen17
- Metargränd26
- Meteorvägen42
- Midnattsvägen4
- Miklagårdsgränd15
- Minutgränd3
- Mistelvägen12
- Mjölgatan9
- Mjölnarvägen11
- Molnbackavägen2
- Molnsättravägen4
- Monsunvägen44
- Morgonvägen8
- Morkullevägen64
- Mossvägen6
- Munspelsgränd3
- Mustanggatan11
- Myntvägen34
- Myrténvägen6
- Månadsvägen8
- Månskensgränd32
- Månvägen4
- Mälarvägen1
- Mäldgatan19
- Mäldgränd6
- Mässingsvägen13
- Mörtgränd20
N22 streets
- Nadirvägen7
- Nebulosavägen14
- Neptunivägen13
- Nettovägen5
- Nibblevägen13
- Nidarosslingan73
- Nordanvägen17
- Norra Hummelmorarondellen
- Norrskensvägen15
- Norrviksvägen10
- Norsgränd14
- Notarievägen1
- Notgränd24
- Novagränd5
- Novembervägen25
- Nybergsvägen7
- Nybodavägen37
- Nydalsvägen13
- Nypongränd3
- Nyårsvägen61
- Näckrosvägen13
- Nämndemansstigen6
O17 streets
P38 streets
- Paddelvägen20
- Palettvägen23
- Pannågränd24
- Paranötsgränd25
- Parkvägen11
- Passadvägen
- Pastellgränd10
- Penningvägen32
- Penselgränd1
- Perseusvägen14
- Persikovägen15
- Pianogränd2
- Pilkargränd16
- Pilotvägen8
- Pingstvägen15
- Pionvägen32
- Planetvägen10
- Planvägen27
- Platåvägen20
- Plogvägen4
- Plommonvägen12
- Plutovägen23
- Polarisvägen46
- Polhemsvägen
- Polluxgränd13
- Polstjärnans gränd7
- Polygonvägen19
- Ponnyvägen17
- Poppelvägen24
- Porträttvägen14
- Predikantvägen5
- Pressarvägen6
- Prismavägen13
- Propellergränd5
- Prostgränd5
- Prästvägen3
- Påskvägen11
- Päronvägen11
R41 streets
- Raketvägen14
- Ramgränd18
- Rapsvägen16
- Reavägen26
- Regnbågsvägen12
- Rektorsvägen16
- Reliefvägen10
- Relävägen43
- Remontvägen23
- Resedavägen7
- Riddarstråket9
- Riddarvägen2
- Ridstigen10
- Riksdalervägen29
- Ringarvägen13
- Ringvägen4
- Ripvägen33
- Rodergränd5
- Rondellen3
- Rotebroleden
- Rotevägen3
- Rudbecks väg18
- Runristarvägen14
- Runstensrondellen1
- Runstensvägen8
- Runvägen13
- Ruskvädersgränd32
- Russingränd64
- Rustningsgränd3
- Rymdvägen10
- Ryttarvägen25
- Rågvägen21
- Rågången25
- Råstensvägen20
- Räfsvägen12
- Räkvägen10
- Rödhakevägen17
- Rödklintsvägen2
- Rödluvevägen9
- Rönnvägen12
- Rösvägen14
S107 streets
- S:t Eriks väg10
- Sabbatsvägen18
- Sadelvägen10
- Safirgatan9
- Sagovägen4
- Saldovägen17
- Sandviks gårdsväg
- Satellitvägen15
- Saturnushöjden13
- Saturnusvägen23
- Saxofongränd16
- Sedelvägen35
- Segersällsvägen2
- Seldonsvägen27
- Semestervägen68
- Septembervägen9
- Serenadgränd32
- Sergeantgränd23
- Siestavägen17
- Sigillvägen8
- Siktvägen20
- Siriusvägen18
- Sjöbrisgränd44
- Skalvägen19
- Skarprättarvägen14
- Skiftesvägen21
- Skillingvägen37
- Skimmelvägen29
- Skogstorpsvägen39
- Skogsvägen41
- Skridskovägen30
- Skulpturvägen20
- Skvadrongränd39
- Skylvägen14
- Skymningsvägen9
- Skyttens väg11
- Skälby Gårds väg17
- Skälbyvägen157
- Sköldvägen48
- Skördevägen4
- Slammertorpsvägen4
- Slåttervägen44
- Släntvägen33
- Slöjdvägen20
- Smedvägen4
- Snapphanevägen30
- Snutenvägen2
- Snövitvägen8
- Snövägen32
- Solbackavägen2
- Soldat Dockes väg5
- Soldat Ståhls gränd13
- Soldat Stäkbergs gränd6
- Soldat Winges gränd13
- Solrosvägen11
- Solskensgränd22
- Solvägen28
- Sommarvägen16
- Sonatgränd22
- Sopranvägen24
- Spadvägen15
- Spaningsvägen16
- Spettvägen15
- Spinettgränd2
- Spisvägen2
- Spjutvägen7
- Sporrvägen39
- Staffligränd18
- Stallbacken10
- Stationsmästargatan2
- Statyvägen14
- Stavhoppargränd2
- Stellan Mörners väg16
- Stellavägen14
- Stenbockens väg39
- Stenkilsgränd8
- Stenvägen14
- Stereovägen41
- Stiltjegränd7
- Stjärnvägen29
- Stora Björnens gränd11
- Stormvägen22
- Stråvägen4
- Sturevägen11
- Stuterivägen32
- Stålringen46
- Stäketleden5
- Stäketsvägen12
- Stäkshöjden66
- Stängselvägen26
- Sunnanvindsgränd12
- Svarvargränd2
- Sven Palms allé4
- Sven Wahlbergs gränd3
- Sverkersvägen2
- Svetsarvägen8
- Sviskonvägen17
- Svärdvägen8
- Symfonigränd39
- Syrénvägen8
- Sångvägen10
- Såningsvägen44
- Säby gårds väg6
- Sälgvägen13
- Särlavägen34
- Sätervägen32
- Södra Hummelmorarondellen1
T50 streets
- Taffelgränd1
- Tamburingränd3
- Tavelvägen35
- Tegelhagsvägen32
- Tegvägen5
- Teknikvägen5
- Tellusvägen18
- Tennisvägen5
- Tennringen63
- Tenorgränd10
- Termovägen17
- Terrängvägen80
- Timglasvägen13
- Timotejvägen15
- Tjurgränd10
- Tjädervägen12
- Tomasvägen2
- Tomtevägen8
- Toppvägen65
- Torlarpsvägen23
- Tornérplatsen9
- Tornérvägen4
- Torpvägen18
- Traktorvägen10
- Tranvägen8
- Trappebergshöjden9
- Trappebergsvägen24
- Trastvägen19
- Travarvägen68
- Trehörningen7
- Triangelvägen19
- Trimvägen48
- Trollvägen7
- Trombvägen56
- Trumpetvägen49
- Trålargränd7
- Tröskvägen25
- Tubvägen20
- Tulpanvägen29
- Tunnangatan14
- Tunnlandsvägen53
- Tunvägen10
- Turbingränd3
- Tvillingarnas väg9
- Tvåspannsvägen91
- Tvärvägen3
- Tyfongränd11
- Tygelvägen13
- Tånglötsvägen2
- Tömvägen23
U7 streets
V49 streets
- Vagnsgatan2
- Vallmovägen18
- Vallvägen31
- Valnötsvägen11
- Valutavägen14
- Vasavägen20
- Vattenkvarnsgatan1
- Vattenverksvägen3
- Vattmyragränd7
- Vattumannens gränd11
- Veckovägen17
- Veddestabron7
- Veddestastråket2
- Veddestavägen15
- Vegagränd30
- Vendelgränd17
- Ventilvägen10
- Venusvägen12
- Vetevägen20
- Vibblabyvägen11
- Vickervägen23
- Viggengatan19
- Vikingarondellen
- Vikingavägen14
- Viksjöleden28
- Viksjöplan9
- Vildgässbacken4
- Vindilsgränd29
- Vindpustgränd14
- Vindslingan32
- Vinggränd3
- Vinkelbacken16
- Vinlandsvägen2
- Vintervägen30
- Violvägen10
- Virvelvägen46
- Volmvägen12
- Vretstigen3
- Vålbergavägen22
- Vårdkasevägen37
- Vårvägen13
- Våråsvägen10
- Väderkvarnsgatan10
- Vädurens väg23
- Vältvägen6
- Värdshusvägen4
- Värmevägen4
- Västanvägen40
- Växthusvägen4
W1 street
Y2 streets
Z2 streets
Å7 streets
Ä4 streets
Ö2 streets
Streets: © OpenStreetMap contributors, ODbL 1.0 – one street per name and kommun.
What VERA PI does not show here, and why
- No individual sale. The price of a house or an owner-occupied flat sits in Lantmäteriet’s register of sale prices (fastighetsprisregistret), which is not open data; SCB publishes it as statistics by kommun and län, and those are the prices shown here. A bostadsrätt is a share in a housing association, not real property – its sales are in no public register at all (the figures for bostadsrätter are SCB’s statistics by län).
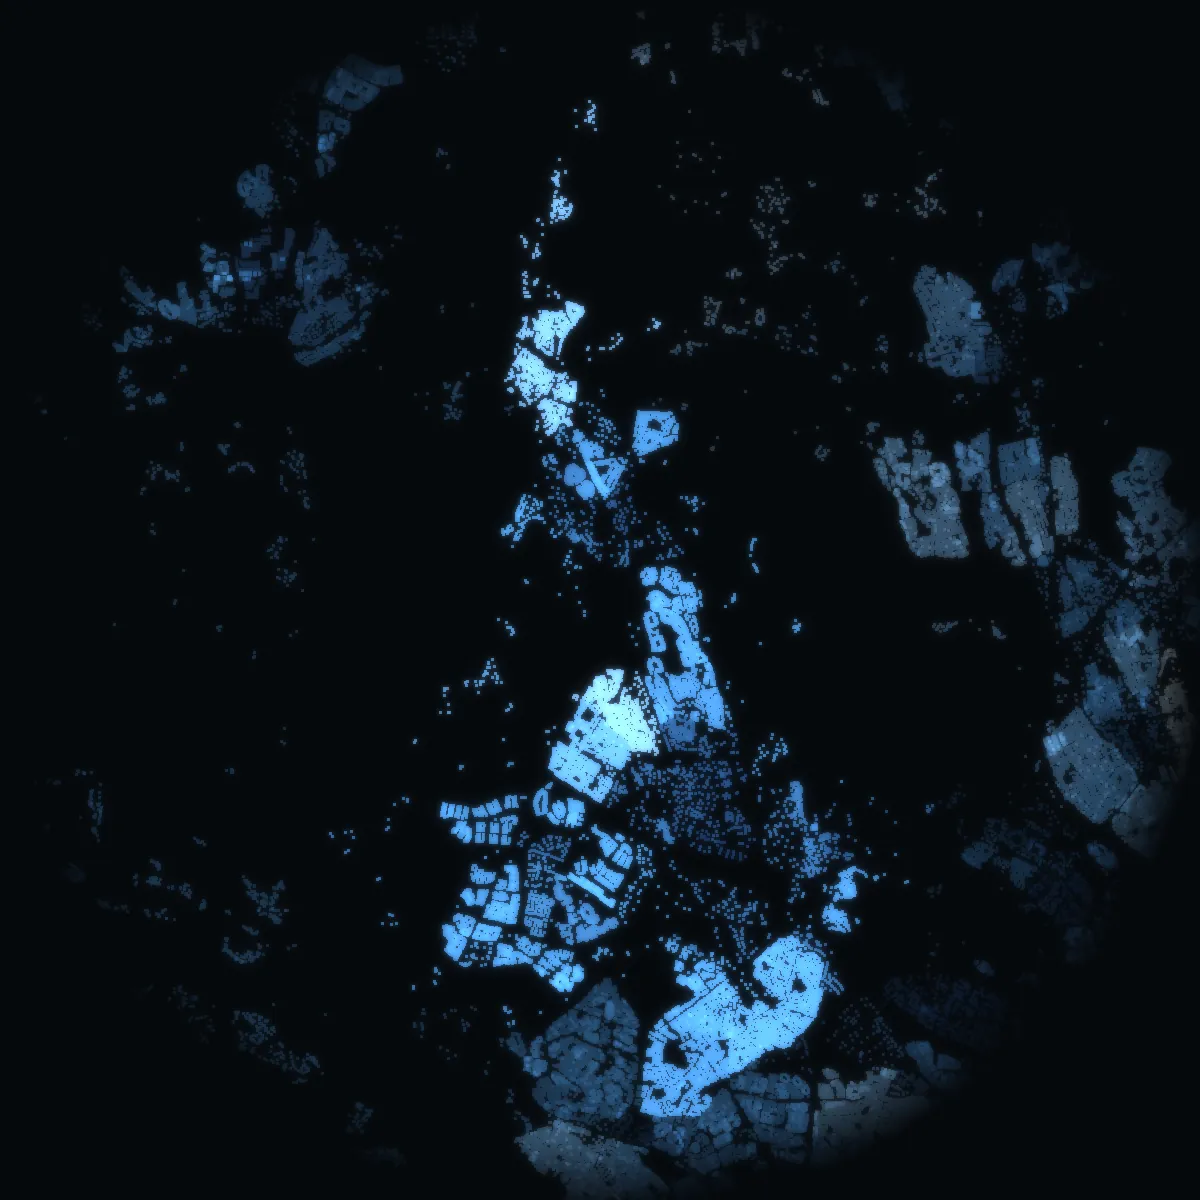
- No prices below the kommun: SCB does not publish sale prices by stadsdel or DeSO. The night picture is coloured by the mean net income of each DeSO area, never by a price.
- No property boundary, no address file and no building’s own record: Lantmäteriet’s open property, address and building data (high-value datasets, CC BY 4.0) are released only on an approved application, which VERA PI has not yet made.
- No asking prices and no listings: Hemnet’s and Booli’s terms do not allow their listings to be copied, and VERA PI does not copy them.
- No estimate for a home: without sale-level data an estimate would be a guess, and VERA PI does not publish guesses.
Sources and licences
Every figure, and where it comes from.
Every figure is official statistics from Statistics Sweden (SCB) under CC BY 4.0 – «Source: Statistics Sweden» – for the period stated beside it; boundaries from SCB’s DeSO 2025 and Stockholms stad’s Stadskarta (© Stockholms stad, Stadsbyggnadskontoret, CC BY); school units from Skolverket; buildings, stations and parks © OpenStreetMap contributors (ODbL 1.0). Nothing here is a valuation. VERA PI has processed the figures (sums over DeSO areas, changes, ranks).
- Statistics Sweden (SCB) – Statistikdatabasenfastighetspriser och lagfarter (BO0501), bostadsbestånd (BO0104), hyror (BO0406), befolkning (BE0101), inkomster (HE0110); read 20 October 2026CC BY 4.0 · Source: Statistics Sweden · www.scb.se
- Statistics Sweden – DeSO 2025 (demographic statistical areas)2025_v2Open geodata, CC BY 4.0 · Source: Statistics Sweden · www.scb.se/vara-tjanster/oppna-data/oppna-geodata
- Stockholms stad – Stadskartan: stadsdelar and stadsdelsnämndsområdenStadsbyggnadskontoret, DataportalenCC BY · © Stockholms stad, Stadsbyggnadskontoret · dataportalen.stockholm.se
- Skolverket – the school-unit register and planned educationsopen APIs, read 20 October 2026Open data · Source: Skolverket · www.skolverket.se
- OpenStreetMap – buildings, stations and parksGeofabrik's Sweden extract, 2026-10-20ODbL 1.0 · © OpenStreetMap contributors · www.openstreetmap.org/copyright