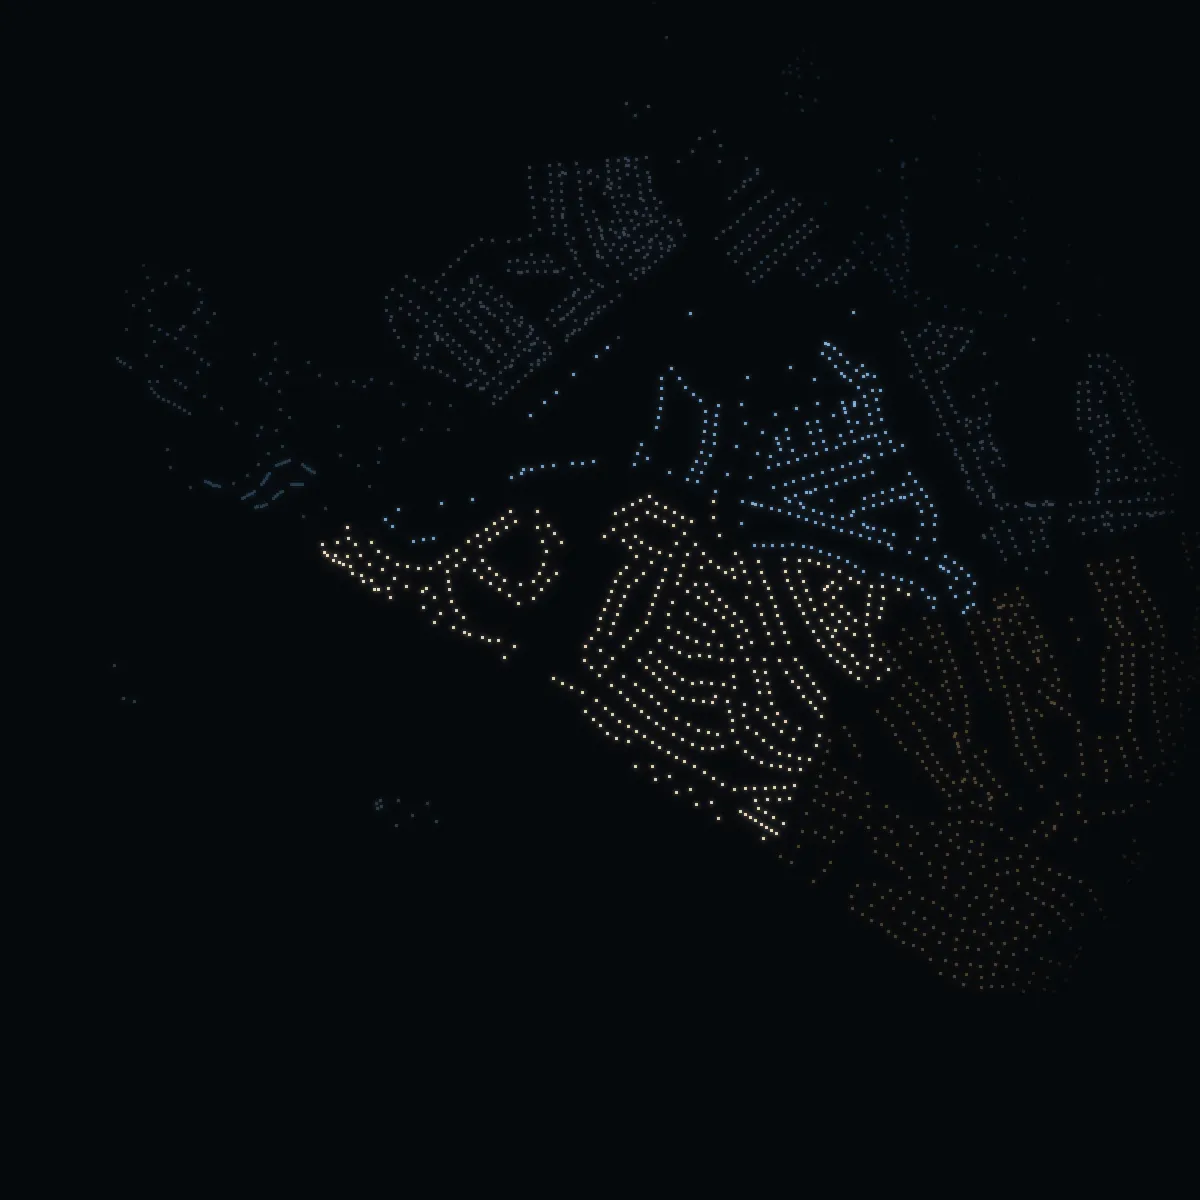
Sweden › Stockholm › Stockholm stad › Nockeby · stadsdel · area statistics
Living in Nockeby.
3,262 people at the end of 2025 (−0.6% in a year), a mean net income of SEK 810k – +73.3% against Stockholm stad – and 25% of the dwellings bostadsrätter. It ranks 8 of 111 stadsdelar by income, in the stadsdelsnämndsområde Bromma.
Official statistics of Statistics Sweden, summed over the DeSO areas of the stadsdel. SCB publishes no sale prices below the kommun – why, below.
Metro Mode on Nockeby
This is Nockeby.
Nockeby is a stadsdel of Bromma, one of the City of Stockholm's district administrations. It has 34 streets; Sigurdsvägen, Gustav III:s Väg and Brynhildsvägen rank highest in the VERA PI Score. Green space means Brålunden (0.6 hectares). Trams stop at Nockeby, Nockeby torg and Olovslund. Trains leave from Nockeby and Nockeby torg. OpenStreetMap counts 4 places to eat and drink. 3,262 people live here, and 41% of the homes are owned outright, mostly houses; more are children and teenagers than in the city as a whole. Families have 4 playgrounds and 1 sports grounds and halls to choose from. Of its 1,377 households, 35% are people living alone without children and 36% are families with children. The area has 0 health centres listed by 1177 and 1 pharmacies. Its streets run to 14.9 kilometres, and it has 1,435 homes. Buses stop at 1 places.
By Metro Mode's editors, from the facts on this pageSources: 1177 / OpenStreetMap · OpenStreetMap · SCB 2025 · SCB 2025 / OpenStreetMap · SL / OpenStreetMap · VERA PI Score
At a glance
Nockeby in figures.
Against Stockholm stad. The mark on each bar is Stockholm.
Residents
3,262
end of 2025
SCB 2025
Bostadsrätter
25%
of 1,435 homes · Stockholm 49%
SCB 2025
Mean net income
SEK 810k
per person 20+ a year · Stockholm SEK 468k
SCB 2024
Aged 0–19
25%
of the residents · Stockholm 21%
SCB 2025
VERA PI Score
65 of 100
median of its 34 streets · Stockholm's streets: 50
VERA PI Score, version 1
Asking price, median
SEK 63,293/m²
3 bostadsrätter for sale with price and size
The agencies' adverts, 21 Oct 2026 – asking prices
The streets
All 34 streets, ranked.
Every street with its VERA PI Score – a ranking among Stockholm stad's 4,346 streets, not a price. Highest here: Sigurdsvägen with 84; together 14.9 km.
- 1Sigurdsvägen84Transport 87 · Parks 33 · Income 82 · Schools 67
- 2Gustav III:s Väg83Transport 78 · Parks 67 · Income 59 · Schools 67
- 3Brynhildsvägen78Transport 87 · Parks 39 · Income 82 · Schools 32
- 4Skaldevägen78Transport 87 · Parks 27 · Income 94 · Schools 32
- 5Nockeby Torg78Transport 87 · Parks 41 · Income 93 · Schools 9
- 6Thespisvägen78Transport 87 · Parks 23 · Income 97 · Schools 32
- 7Nockeby Kyrkväg76Transport 87 · Parks 38 · Income 93 · Schools 9
- 8Orsavägen76Transport 87 · Parks 35 · Income 96 · Schools 9
- 9Författarvägen73Transport 78 · Parks 25 · Income 97 · Schools 32
- 10Flodavägen73Transport 87 · Parks 26 · Income 96 · Schools 9
- 11Grönviksvägen73Transport 78 · Parks 24 · Income 97 · Schools 32
- 12Rättviksvägen72Transport 87 · Parks 25 · Income 96 · Schools 9
- 13Oxbergsvägen71Transport 87 · Parks 25 · Income 93 · Schools 9
- 14Brålunden68Transport 69 · Parks 42 · Income 82 · Schools 32
- 15Kung Atles Väg67Transport 78 · Parks 41 · Income 82 · Schools 9
- 16Guttormsvägen66Transport 78 · Parks 26 · Income 82 · Schools 32
- 17Idrevägen65Transport 78 · Parks 24 · Income 96 · Schools 9
- 18Talgoxvägen65Transport 78 · Parks 24 · Income 96 · Schools 9
- 19Moravägen65Transport 69 · Parks 22 · Income 96 · Schools 32
- 20Limavägen64Transport 69 · Parks 34 · Income 96 · Schools 9
- 21Särnavägen64Transport 69 · Parks 34 · Income 96 · Schools 9
- 22Gudrunsvägen64Transport 69 · Parks 34 · Income 82 · Schools 32
- 23Nåsvägen64Transport 69 · Parks 33 · Income 96 · Schools 9
- 24Svanhildsvägen61Transport 69 · Parks 41 · Income 82 · Schools 9
- 25Gulsparvsvägen59Transport 69 · Parks 23 · Income 96 · Schools 9
- 26Reginsvägen56Transport 60 · Parks 32 · Income 82 · Schools 32
- 27Gunnarsvägen56Transport 69 · Parks 33 · Income 82 · Schools 9
- 28Korpgränd53Transport 60 · Parks 11 · Income 96 · Schools 32
- 29Grangärdevägen52Transport 60 · Parks 23 · Income 96 · Schools 9
- 30Leksandsvägen49Transport 53 · Parks 11 · Income 96 · Schools 32
- 31Gagnefsvägen47Transport 53 · Parks 22 · Income 96 · Schools 9
- 32Svärdsjövägen47Transport 53 · Parks 22 · Income 96 · Schools 9
- 33Djuravägen41Transport 40 · Parks 11 · Income 98 · Schools 32
- 34Malungsvägen38Transport 46 · Parks 11 · Income 96 · Schools 9
VERA PI Score version 1: transport 35 %, parks 25 %, area income 25 %, schools 15 %, each a ranking among the city's streets.
For sale
For sale now.
7 homes for sale in the agencies' own adverts, 21 Oct 2026, 3 bostadsrätter with price and size. Half ask between SEK 59,210/m² and SEK 74,934/m²; the median flat asks SEK 2.6m.
Asking price per m²
Bostadsrätter 6 · Houses 1
Who is selling
VERA PI's nightly read of the estate agencies' own websites (robots.txt and terms respected; not Hemnet, not Booli) – asking prices, never sale prices; no single home is shown here.
VERA PISun
How much sun Nockeby gets.
The median of the stadsdel's 668 residential buildings gets 8.7 hours of direct sun on a clear day on 21 March, on its sunniest facade. Stockholm's median is 7.8 hours – Nockeby is no. 12 of 110.
21 March the equinox
8.7 hours
Stockholm 7.8 hdaylight 12.2 h
21 December the solstice
2.0 hours
Stockholm 1.7 hdaylight 6.1 h
21 September trees in leaf
8.8 hours
Stockholm 7.8 hdaylight 12.3 h
The sunniest apartment buildings
The top 10 of 38.
Large figure: 21 March21 December21 September, trees in leaf
- 1Brålunden 10–12facing S · 1st floor10.7 h21 December: 2.4 21 September: 10.7
- 2Brålunden 6facing S · 1st floor10.6 h21 December: 4.4 21 September: 10.7
- 3Brålunden 8facing S · 1st floor10.6 h21 December: 3.2 21 September: 10.7
- 4Brålunden 14facing S · 1st floor10.6 h21 December: 0.3 21 September: 10.7
- 5Brålunden 2–4facing S · 1st floor10.5 h21 December: 4.4 21 September: 10.6
- 6Nockeby Torg 11facing S · 1st floor10.5 h21 December: 3.2 21 September: 10.4
- 7Nockeby Torg 2–4facing S · 1st floor10.4 h21 December: 3.8 21 September: 10.4
- 8Nockeby Torg 25–27facing S · 1st floor10.4 h21 December: 1.9 21 September: 10.3
- 9Nockeby Torg 1facing Nockeby Torg (SSW) · 1st floor10.3 h21 December: 1.2 21 September: 10.2
- 10Brynhildsvägen 18facing Brynhildsvägen (SSE) · 1st floor10.2 h21 December: 2.0 21 September: 10.2
The sunniest streets
The median of each street's residential buildings (at least three).
- 1Svanhildsvägen13 residential buildings · sunniest: the east side10.7 h21 December: 2.6 21 September: 10.7
- 2Nockeby Kyrkväg11 residential buildings · sunniest: the east side10.1 h21 December: 2.4 21 September: 10.2
- 3Reginsvägen5 residential buildings10.1 h21 December: 0.6 21 September: 10.3
- 4Brålunden12 residential buildings · sunniest: the north-west side9.8 h21 December: 3.3 21 September: 9.9
- 5Grönviksvägen12 residential buildings · sunniest: the north side9.7 h21 December: 5.8 21 September: 9.7
No. 12 of 110 stadsdelar
The sunniest homes in Stockholm
How VERA PI measures the sun
Solläge is the number of hours of direct sun on a clear day on 21 March on a building's sunniest facade – at least 8 metres long – at its middle floor. Winter is the same on 21 December; on 21 September the trees count, in leaf. Neighbouring buildings, the terrain and the trees cast the shade. Medians are of the residential buildings; the lists name apartment buildings only – houses and terraced houses count in the medians but are never shown one by one.
The sun's path: NOAA's solar calculation. The buildings' heights: Stockholms stad's 3D buildings (the city planning office, SBK) – only derived values are shown, hours and rounded heights. Streets, addresses and trees: © OpenStreetMap contributors, ODbL 1.0. Calculated 21 October 2026.
Who lives here
Who lives here.
3,262 people live in Nockeby. The figures are SCB's for the 2 DeSO areas the site counts to the stadsdel – together they cover 98.0% of its area, and 99.5% of their own area lies inside it.
Age
Share of the residents in each age group, 2025.
Households
Share of 1,377 households, 2025.
Net income, mean
SEK 810kPer person 20 and over, a year, 2024 – the latest SCB gives by area
1.7 times Stockholm's
Capital income, mean
SEK 336kPer person 20 and over, 2024 – gains on shares and property included
2.6 times Stockholm's
Three years or more of higher education
67%Share of those aged 25–64, 2025
20.3 percentage points above Stockholm
Privately owned cars
336In use, per 1,000 residents, 2025
1.6 times Stockholm's
Tenure
25%Bostadsrätt · rented · owned, share of homes 2025
Statistics Sweden (SCB), CC BY 4.0 – DeSO areas 0180C3850, 0180C4000. Incomes are means: a few very high incomes pull them up.
Schools
Schools nearby.
No school unit in Skolverket's open register lies inside the stadsdel.
Care and everyday
Care and everyday.
Health centres, pharmacies and dentists in the stadsdel – and the nearest emergency departments, however far away they are.
In an emergency: 112 Health advice, day and night: 1177 Police, non-emergency: 114 14
None in the stadsdel
Akutmottagningen, Capio S:t Görans Sjukhus
Sankt Göransgatan 139, Akutmottagningen, Plan 01, Capio S:T Görans Sjukhus, Stockholm · 08-587 010 00
4.8 km from the stadsdel
- Akutmottagningen, Södersjukhuset6.9 km
- Akutmottagning, Danderyds sjukhus8.9 km
Akutmottagning Barn Solna, Karolinska Universitetssjukhuset
Anna Steckséns Gata 35, Solna · 08-123 771 02
5.9 km from the stadsdel
- Akutmottagningen, Sachsska barn- och ungdomssjukhuset7.1 km
- Akutmottagning Barn Huddinge, Karolinska Universitetssjukhuset11.1 km
Närakut Järva
Rinkebysvängen 70, Spånga · 08-123 366 39
5.9 km from the stadsdel
- Närakut Haga6.1 km
- Närakut Rosenlund7.2 km
1 in the stadsdel
- Apotek Hjärtat
Polisen Solna, passexpedition
Sundbybergsvägen 17, Solna
4.4 km from the stadsdel
- Polisen Vällingby4.5 km
- Grocery shops
- 1
- Preschools
- 1
- Post and parcels
- 1
Emergency departments, urgent care and health centres checked against 1177 (Region Stockholm), police stations against Polisen's open API, the rest © OpenStreetMap contributors (ODbL), counted only where OpenStreetMap lists any. Distances in a straight line from the stadsdel's boundary.
Getting around
Getting around.
Nockeby, Nockeby torg, Olovslund
Nockeby, Nockeby torg, Olovslund
1 bus stops in the stadsdel
Stops and stations © OpenStreetMap contributors (ODbL) and SL/Trafiklab.
Parks and outdoors
Parks, water and sport.
The parks
Play and sport
- Playgrounds
- 4
- Sports grounds and halls
- 1
- Bathing places
- 2
- Dog parks
- 0
Parks and areas: OpenStreetMap (ODbL), read 20 Oct 2026.
Food and culture
Food, culture and Metro Mode's picks.
4 places to eat and drink and 0 hotels in the stadsdel by OpenStreetMap.
Culture
Places © OpenStreetMap contributors. MICHELIN Guide Sweden 2026 (guide.michelin.com, read 20 Oct 2026), placed where exactly one OpenStreetMap restaurant in Stockholm stad has the name. Metro Mode: the editors' own Stockholm guides and lists, published 2025 or later.
History
History and heritage.
Nockeby är en stadsdel i Västerort inom Stockholms kommun och är en del av Bromma trädgårdsstad. Den ingår i stadsdelsområdet Bromma och har en yta på 98 hektar.
Swedish Wikipedia (CC BY-SA 4.0), quoted as written; Stadsmuseet i Stockholm, Byggnadsinventering, via Stockholmskällan, where VERA PI has read it.
Safety
Safety, by area.
By area only – never by building or street.
Building and planning
Building and planning.
Stockholms stad lists no project for the stadsdel in Stockholm växer.
Housing associations
The associations behind the doors.
The 2026 election
The 2026 election.
The general election of 13 September 2026, final result, in the 2 voting districts lying in the stadsdel. Each district is shown on its own – the figures are the district's, not the stadsdel's or any street's.
The districtStockholms kommun
Västerled 12 Nockeby S1,323 eligible voters · turnout 89.5%
Västerled 13 Nockeby N1,322 eligible voters · turnout 90.8%
Stockholm, the county and Sweden
| Party | Stockholm | County | Sweden |
|---|---|---|---|
| Moderates | 19.1% | 21.8% | 19.9% |
| Centre Party | 9.8% | 8.6% | 7.0% |
| Liberals | 7.1% | 6.8% | 5.3% |
| Christian Democrats | 3.9% | 4.9% | 6.2% |
| Social Democrats | 26.3% | 26.0% | 28.0% |
| Left Party | 13.0% | 10.2% | 8.4% |
| Green Party | 11.1% | 8.0% | 6.1% |
| Sweden Democrats | 8.4% | 12.1% | 17.5% |
| Other parties | 1.2% | 1.4% | 1.6% |
| Turnout | 85.8% | 84.7% | 84.9% |
Share of the valid votes in each district. The mark on each bar is Stockholms kommun. Change since 2022 in percentage points. Late early votes are counted in the municipality's collection district and are in no district's shares. The election is not part of the VERA PI Score. Source: Valmyndigheten, final result, published 7 Oct 2026.
Stadsdelar
Among Stockholm’s stadsdelar.
111 stadsdelar, grouped by the city’s stadsdelsnämndsområden: the people and their change in a year, the mean net income and how the dwellings are held. SCB publishes no sale prices below the kommun.
| Stadsdel | People | 1 yr | Net income | Bostadsrätt | Rented | Owned |
|---|---|---|---|---|---|---|
| Norra innerstaden | ||||||
| Djurgården | 813 | −1.7% | SEK 1,593k | 13% | 62% | 25% |
| Östermalm | 39,122 | −0.2% | SEK 1,194k | 74% | 26% | 0% |
| Vasastaden | 64,025 | +0.3% | SEK 618k | 70% | 30% | 0% |
| Norrmalm | 8,549 | +0.2% | SEK 616k | 56% | 44% | 0% |
| Hjorthagen | 8,482 | −0.6% | SEK 595k | 50% | 50% | 0% |
| Ladugårdsgärdet | 24,078 | +0.1% | SEK 532k | 62% | 38% | 0% |
| Norra Djurgården | 11,113 | +2.1% | SEK 234k | 17% | 83% | 0% |
| Kungsholmen | ||||||
| Kungsholmen | 34,794 | −0.1% | SEK 605k | 73% | 27% | 0% |
| Stora Essingen | 4,497 | −0.6% | SEK 545k | 62% | 27% | 11% |
| Marieberg | 4,574 | +0.9% | SEK 534k | 89% | 11% | 0% |
| Stadshagen | 9,558 | +3.0% | SEK 520k | 55% | 43% | 1% |
| Lilla Essingen | 4,837 | +0.1% | SEK 484k | 67% | 33% | 0% |
| Kristineberg | 7,896 | +0.7% | SEK 477k | 71% | 29% | 0% |
| Fredhäll | 5,371 | +0.7% | SEK 436k | 58% | 42% | 0% |
| Bromma | ||||||
| Höglandet | 1,355 | −0.6% | SEK 1,338k | 16% | 7% | 77% |
| Ålsten | 3,195 | −0.3% | SEK 1,133k | 25% | 2% | 73% |
| Smedslätten | 2,523 | −0.6% | SEK 1,026k | 29% | 20% | 51% |
| Äppelviken | 1,989 | −1.4% | SEK 962k | 35% | 13% | 52% |
| Södra Ängby | 1,638 | +0.9% | SEK 940k | 9% | 1% | 90% |
| Nockeby | 3,262 | −0.6% | SEK 810k | 25% | 34% | 41% |
| Stora Mossen | 1,700 | −2.8% | SEK 778k | 39% | 14% | 47% |
| Bromma kyrka | 2,692 | −0.1% | SEK 701k | 6% | 8% | 86% |
| Nockebyhov | 3,950 | −1.6% | SEK 569k | 33% | 33% | 33% |
| Alvik | 1,487 | −0.1% | SEK 539k | 58% | 39% | 4% |
| Norra Ängby | 6,173 | −0.6% | SEK 525k | 14% | 30% | 56% |
| Bällsta | 804 | −2.9% | SEK 496k | 5% | 6% | 89% |
| Eneby | 878 | +1.0% | SEK 493k | 4% | 3% | 93% |
| Ulvsunda | 2,775 | −0.3% | SEK 483k | 31% | 50% | 19% |
| Mariehäll | 10,826 | +0.5% | SEK 447k | 62% | 36% | 2% |
| Beckomberga | 5,877 | +0.1% | SEK 438k | 67% | 25% | 8% |
| Traneberg | 7,631 | −0.7% | SEK 414k | 61% | 39% | 0% |
| Abrahamsberg | 3,394 | −2.7% | SEK 409k | 44% | 56% | 0% |
| Ulvsunda industriområde | 3,448 | −0.8% | SEK 387k | 67% | 33% | 0% |
| Riksby | 5,241 | +1.7% | SEK 382k | 80% | 19% | 0% |
| Åkeslund | 3,647 | +2.9% | SEK 378k | 57% | 43% | 0% |
| Blackeberg | 8,908 | −0.4% | SEK 350k | 40% | 60% | 1% |
| Södermalm | ||||||
| Gamla stan | 3,012 | −2.5% | SEK 553k | 38% | 62% | 0% |
| Reimersholme | 1,445 | +0.5% | SEK 530k | 80% | 20% | 0% |
| Södra Hammarbyhamnen | 20,151 | −0.7% | SEK 529k | 64% | 36% | 0% |
| Långholmen | 1,015 | +0.6% | SEK 490k | 91% | 9% | 0% |
| Södermalm | 104,807 | −0.2% | SEK 479k | 55% | 45% | 0% |
| Hägersten-Älvsjö | ||||||
| Mälarhöjden | 4,378 | −0.6% | SEK 614k | 29% | 6% | 66% |
| Långsjö | 3,016 | −0.5% | SEK 604k | 7% | 4% | 89% |
| Herrängen | 3,843 | −0.9% | SEK 582k | 4% | 2% | 95% |
| Långbro | 7,603 | −0.2% | SEK 513k | 36% | 19% | 45% |
| Liljeholmen | 20,046 | +1.5% | SEK 477k | 67% | 30% | 2% |
| Hägersten | 9,913 | +0.2% | SEK 473k | 40% | 39% | 21% |
| Liseberg | 1,432 | −1.5% | SEK 441k | 17% | 51% | 32% |
| Gröndal | 9,062 | −0.5% | SEK 429k | 70% | 30% | 0% |
| Örby slott | 2,067 | −1.8% | SEK 418k | 57% | 19% | 24% |
| Midsommarkransen | 10,166 | +1.4% | SEK 410k | 68% | 32% | 0% |
| Älvsjö | 1,807 | +3.1% | SEK 408k | 15% | 62% | 23% |
| Västberga | 7,600 | +1.7% | SEK 392k | 60% | 34% | 6% |
| Aspudden | 8,926 | −0.1% | SEK 384k | 51% | 48% | 1% |
| Fruängen | 9,719 | −0.4% | SEK 375k | 64% | 33% | 3% |
| Hägerstensåsen | 8,498 | −0.4% | SEK 367k | 41% | 58% | 1% |
| Solberga | 14,212 | +1.0% | SEK 366k | 43% | 52% | 5% |
| Västertorp | 7,536 | −1.8% | SEK 350k | 38% | 61% | 1% |
| Skarpnäck | ||||||
| Enskededalen | 2,655 | −1.1% | SEK 560k | 36% | 22% | 41% |
| Hammarbyhöjden | 10,744 | −0.2% | SEK 412k | 70% | 30% | 0% |
| Björkhagen | 6,960 | +2.5% | SEK 398k | 52% | 45% | 2% |
| Skarpnäcks gård | 7,021 | −0.4% | SEK 380k | 43% | 41% | 16% |
| Orhem | 1,885 | +0.2% | SEK 352k | 100% | 0% | 0% |
| Kärrtorp | 5,826 | +2.0% | SEK 352k | 41% | 59% | 0% |
| Skrubba | 1,946 | −2.8% | SEK 340k | 50% | 29% | 21% |
| Bagarmossen | 11,399 | −0.7% | SEK 337k | 30% | 64% | 6% |
| Enskede-Årsta-Vantör | ||||||
| Enskedefältet | 1,947 | +0.1% | SEK 505k | 10% | 37% | 53% |
| Stureby | 8,505 | −0.5% | SEK 499k | 42% | 34% | 24% |
| Örby | 5,968 | +0.3% | SEK 484k | 27% | 19% | 54% |
| Enskede gård | 3,314 | −0.2% | SEK 479k | 20% | 52% | 27% |
| Gamla Enskede | 10,874 | +0.9% | SEK 470k | 46% | 36% | 18% |
| Årsta | 20,659 | +0.1% | SEK 406k | 70% | 30% | 0% |
| Johanneshov | 6,355 | +0.4% | SEK 374k | 50% | 50% | 0% |
| Bandhagen | 8,270 | +3.2% | SEK 321k | 28% | 71% | 2% |
| Högdalen | 10,537 | −0.2% | SEK 320k | 42% | 53% | 5% |
| Östberga | 5,822 | −0.6% | SEK 318k | 85% | 15% | 0% |
| Hagsätra | 9,947 | +0.3% | SEK 304k | 41% | 56% | 3% |
| Rågsved | 12,280 | +2.7% | SEK 257k | 24% | 76% | 0% |
| Farsta | ||||||
| Svedmyra | 3,503 | −0.5% | SEK 419k | 44% | 38% | 18% |
| Sköndal | 10,745 | +1.9% | SEK 409k | 32% | 45% | 23% |
| Tallkrogen | 4,862 | −0.5% | SEK 399k | 3% | 56% | 41% |
| Larsboda | 2,788 | +10.0% | SEK 381k | 58% | 34% | 8% |
| Gubbängen | 5,788 | −0.1% | SEK 348k | 43% | 50% | 7% |
| Farsta | 15,924 | −1.1% | SEK 330k | 44% | 51% | 5% |
| Farsta strand | 5,712 | +1.7% | SEK 324k | 27% | 63% | 10% |
| Fagersjö | 2,898 | +0.5% | SEK 318k | 26% | 57% | 17% |
| Hökarängen | 10,179 | −0.7% | SEK 312k | 20% | 79% | 2% |
| Hässelby-Vällingby | ||||||
| Nälsta | 5,104 | +1.3% | SEK 461k | 10% | 14% | 76% |
| Hässelby villastad | 18,978 | 0.0% | SEK 427k | 11% | 21% | 68% |
| Kälvesta | 4,556 | −0.2% | SEK 412k | 0% | 0% | 100% |
| Vinsta | 4,443 | −0.4% | SEK 359k | 23% | 26% | 51% |
| Råcksta | 10,092 | −0.1% | SEK 337k | 31% | 63% | 6% |
| Vällingby | 8,670 | +0.3% | SEK 328k | 47% | 48% | 5% |
| Hässelby strand | 8,302 | +0.1% | SEK 296k | 35% | 65% | 0% |
| Grimsta | 4,547 | −1.6% | SEK 275k | 29% | 71% | 0% |
| Hässelby gård | 11,630 | +0.2% | SEK 264k | 18% | 77% | 6% |
| Järva | ||||||
| Flysta | 2,323 | +1.4% | SEK 518k | 1% | 20% | 79% |
| Solhem | 7,428 | +0.1% | SEK 506k | 17% | 6% | 76% |
| Bromsten | 8,283 | +7.4% | SEK 360k | 25% | 49% | 26% |
| Lunda | 1,914 | +1.5% | SEK 357k | 61% | 36% | 4% |
| Sundby | 4,053 | +1.1% | SEK 351k | 9% | 69% | 22% |
| Kista | 15,809 | +4.8% | SEK 305k | 50% | 43% | 6% |
| Akalla | 7,314 | +0.5% | SEK 272k | 63% | 32% | 5% |
| Hansta | 2,210 | +0.8% | SEK 266k | 99% | 1% | 0% |
| Husby | 12,350 | +1.5% | SEK 238k | 18% | 82% | 0% |
| Tensta | 18,707 | +0.9% | SEK 229k | 20% | 78% | 2% |
| Rinkeby | 17,084 | −0.1% | SEK 216k | 5% | 93% | 2% |
| Skärholmen | ||||||
| Sätra | 7,620 | +0.4% | SEK 299k | 28% | 57% | 15% |
| Bredäng | 10,873 | +1.2% | SEK 291k | 14% | 79% | 6% |
| Vårberg | 11,122 | +3.7% | SEK 268k | 12% | 74% | 13% |
| Skärholmen | 9,205 | 0.0% | SEK 253k | 30% | 55% | 15% |
Stadsdelar: © Stockholms stad, Stadsbyggnadskontoret (Stadskartan, CC BY); each DeSO area is counted in the stadsdel that holds most of it. Figures: Source: Statistics Sweden, CC BY 4.0.
Prices
The prices around it.
SCB publishes sale prices by kommun and län, not by stadsdel. In Stockholm stad a house sold for SEK 8,850,000 on average in 2025 (+2.9% in a year); a bostadsrätt in Stockholms län for a median of SEK 3,500,000.
Stockholm stad’s prices since 1981 · Stockholms län’s bostadsrätter since 2000
For sale – asking prices
For sale in Nockeby.
7 homes for sale on the agencies’ own websites, read 21 Oct 2026. Bostadsrätter ask a median SEK 63,293 per m² (from 3 listings with area and asking price), and a median monthly fee of SEK 3,183 (SEK 70 per m²). Asking, not sold.
Asking prices as the agencies publish them on their own websites, read by VERA PI every night (robots.txt and each site’s terms obeyed) – not sale prices, and not every agency: Hemnet’s and Booli’s terms forbid copying, and VERA PI does not use them; sites that forbid automated reading are not read. A home sold by two agencies can appear twice. The agency’s name only – never an agent’s or a seller’s.
Streets
Street by street.
34 streets in Nockeby – each with its own page and share card: the buildings along it, the area around it, the walk to the nearest station and the schools near it. The small figure is the number of buildings along the street. No street has a price – SCB publishes prices by kommun only.
- Brynhildsvägen31
- Brålunden8
- Djuravägen15
- Flodavägen20
- Författarvägen62
- Gagnefsvägen18
- Grangärdevägen20
- Grönviksvägen144
- Gudrunsvägen23
- Gulsparvsvägen14
- Gunnarsvägen9
- Gustav III:s Väg49
- Guttormsvägen19
- Idrevägen17
- Korpgränd8
- Kung Atles Väg20
- Leksandsvägen38
- Limavägen8
- Malungsvägen38
- Moravägen44
- Nockeby Kyrkväg23
- Nockeby Torg14
- Nåsvägen38
- Orsavägen45
- Oxbergsvägen7
- Reginsvägen11
- Rättviksvägen34
- Sigurdsvägen53
- Skaldevägen93
- Svanhildsvägen18
- Svärdsjövägen10
- Särnavägen15
- Talgoxvägen11
- Thespisvägen36
Streets: © OpenStreetMap contributors, ODbL 1.0 – one street per name and kommun.
What VERA PI does not show here, and why
- No individual sale. The price of a house or an owner-occupied flat sits in Lantmäteriet’s register of sale prices (fastighetsprisregistret), which is not open data; SCB publishes it as statistics by kommun and län, and those are the prices shown here. A bostadsrätt is a share in a housing association, not real property – its sales are in no public register at all (the figures for bostadsrätter are SCB’s statistics by län).
- No prices below the kommun: SCB does not publish sale prices by stadsdel or DeSO. The night picture is coloured by the mean net income of each DeSO area, never by a price.
- No property boundary, no address file and no building’s own record: Lantmäteriet’s open property, address and building data (high-value datasets, CC BY 4.0) are released only on an approved application, which VERA PI has not yet made.
- No listing from Hemnet or Booli: their terms do not allow their listings to be copied, and VERA PI does not copy them – the asking prices shown are from the estate agencies’ own websites, labelled as asking.
- No estimate for a home: without sale-level data an estimate would be a guess, and VERA PI does not publish guesses.
Sources and licences
Every figure, and where it comes from.
Every figure is official statistics from Statistics Sweden (SCB) under CC BY 4.0 – «Source: Statistics Sweden» – for the period stated beside it; boundaries from SCB’s DeSO 2025 and Stockholms stad’s Stadskarta (© Stockholms stad, Stadsbyggnadskontoret, CC BY); school units from Skolverket; buildings, stations and parks © OpenStreetMap contributors (ODbL 1.0). Nothing here is a valuation. VERA PI has processed the figures (sums over DeSO areas, changes, ranks).
- Statistics Sweden (SCB) – Statistikdatabasenfastighetspriser och lagfarter (BO0501), bostadsbestånd (BO0104), hyror (BO0406), befolkning (BE0101), inkomster (HE0110); read 20 October 2026CC BY 4.0 · Source: Statistics Sweden · www.scb.se
- Statistics Sweden – DeSO 2025 (demographic statistical areas)2025_v2Open geodata, CC BY 4.0 · Source: Statistics Sweden · www.scb.se/vara-tjanster/oppna-data/oppna-geodata
- Stockholms stad – Stadskartan: stadsdelar and stadsdelsnämndsområdenStadsbyggnadskontoret, DataportalenCC BY · © Stockholms stad, Stadsbyggnadskontoret · dataportalen.stockholm.se
- Skolverket – the school-unit register and planned educationsopen APIs, read 20 October 2026Open data · Source: Skolverket · www.skolverket.se
- OpenStreetMap – buildings, stations and parksGeofabrik's Sweden extract, 2026-10-20ODbL 1.0 · © OpenStreetMap contributors · www.openstreetmap.org/copyright