Akutmottagning, Södertälje sjukhus
Erik Dahlbergs väg 14B, Södertälje
Open 24/7
Places
På svenskaSamma sida på svenska Stockholms län26 kommuner on the map Stockholm stadEvery stadsdel ÖstermalmStreet by street StrandvägenHouse by house For saleHomes on the market nowOn Södertäljevägen
The street2,120 mClose byCare and everydayThe area around itSCB, DeSOGetting aroundStops, schools, parksNykvarnThe kommunVERA PI
The companyvpios.com All markets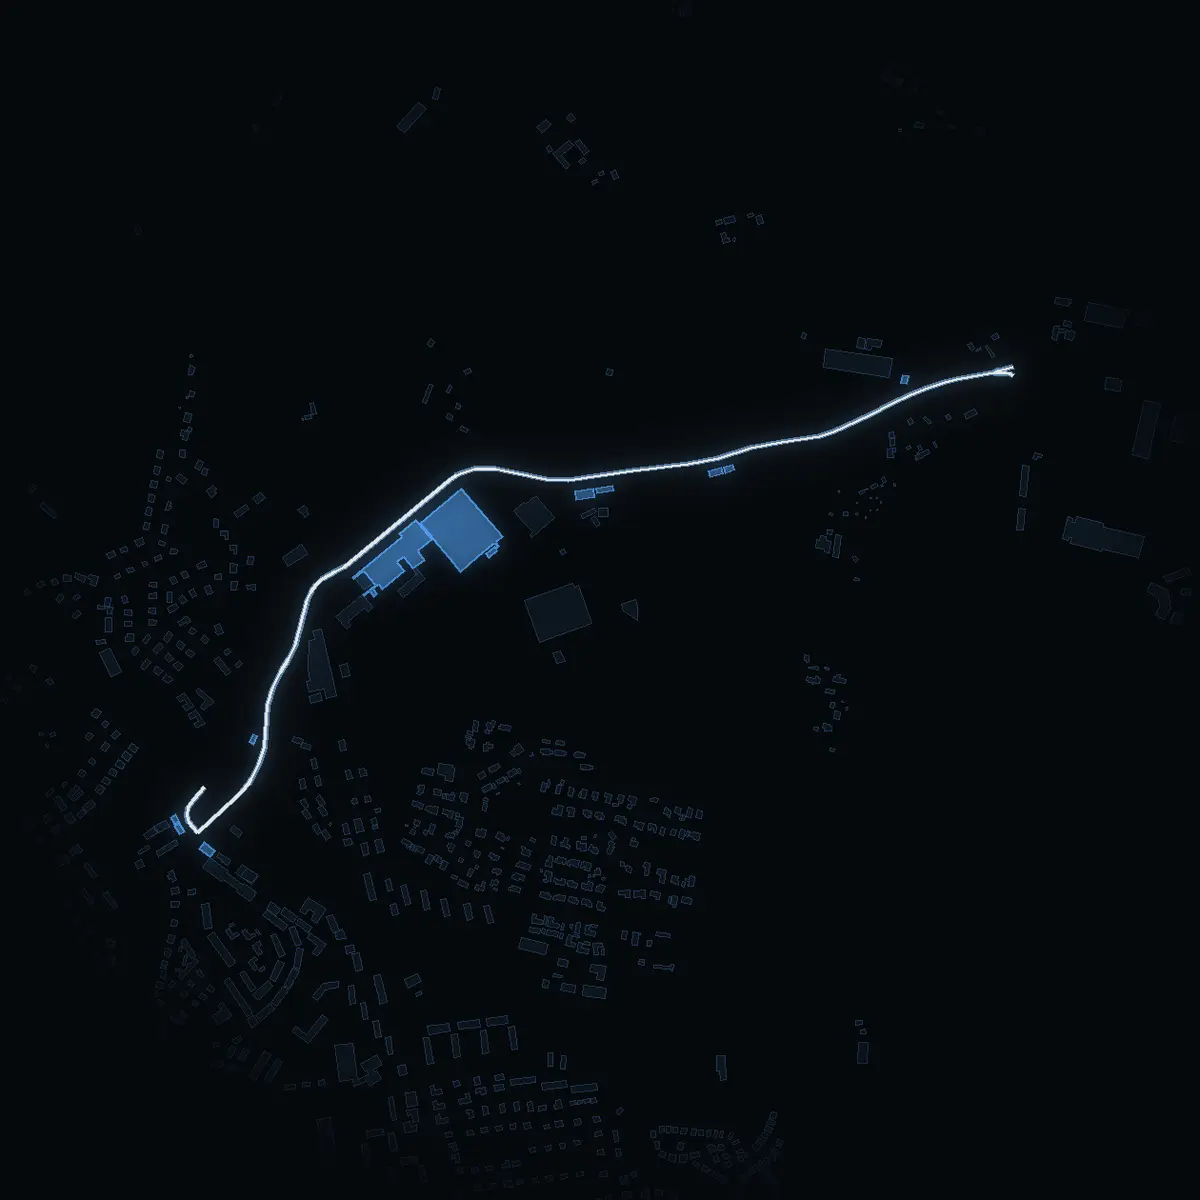
Sweden › Stockholm › Nykvarn · street
11 buildings stand along its 2,120 m in Nykvarn. The DeSO area it runs through has a mean net income of SEK 378k, and 42% of their dwellings are bostadsrätter. Nykvarn (rail) is a 2-minute walk.
The street as OpenStreetMap maps it, its area as SCB counts it. VERA PI shows no street price in Sweden – why, below.
The street
Södertäljevägen is a local through road of about 2,120 m in Nykvarn. OpenStreetMap draws 11 buildings within 25 m of its line.
OpenStreetMap’s own tags – most Swedish buildings carry no use, so «not tagged» is common and says nothing about the building.
The nearest care and everyday places from Södertäljevägen, nearest first, with the way there in Google Maps or Apple Maps. Emergency care is shown however far it is; everything else within 2 km.
In an emergency, call 112Medical advice day and night: 1177
Erik Dahlbergs väg 14B, Södertälje
Open 24/7
Erik Dahlbergs väg 14B, Södertälje
Hälsovägen 13, Huddinge
Open 24/7 · 08-123 809 00
Centrumvägen 2A · 262 m
264 m
Centrumvägen 2
Supermarket · 82 m
Mikael Wincklersväg 24 · 366 m
Distance in a straight line from the nearest point of the street; the walk is estimated at 1.3 times that, at 80 metres a minute. Source: © OpenStreetMap contributors (ODbL), emergency departments, urgent care and health centres from 1177 (Region Stockholm), police stations from Polisen, read 21 October 2026.
The area around it
The street runs through one of SCB’s DeSO areas – Nykvarn. Together they have 1,145 people (2025) with a mean net income of SEK 378k (2024), −5.8% against Nykvarn as a whole. These are the areas’ figures, not the street’s: SCB counts people by area, never by street.
Dwellings in the DeSO areas the street runs through, 516 in all.
People 2025, net income 2024 and dwellings by tenure by DeSO area: Source: Statistics Sweden, CC BY 4.0 – an area counts where at least a tenth of the street runs through it.
The general election of 13 September 2026, final result, in the 3 voting districts Södertäljevägen runs through, the largest share of the street first. The figures are each whole district's, not just the street's.
The districtNykvarn
The district's boundaries have changed since 2022, so Valmyndigheten does not compare it with 2022.
The district's boundaries have changed since 2022, so Valmyndigheten does not compare it with 2022.
The district's boundaries have changed since 2022, so Valmyndigheten does not compare it with 2022.
| Party | Nykvarn | County | Sweden |
|---|---|---|---|
| Moderates | 28.8% | 21.8% | 19.9% |
| Centre Party | 5.5% | 8.6% | 7.0% |
| Liberals | 5.4% | 6.8% | 5.3% |
| Christian Democrats | 6.0% | 4.9% | 6.2% |
| Social Democrats | 21.1% | 26.0% | 28.0% |
| Left Party | 3.2% | 10.2% | 8.4% |
| Green Party | 3.3% | 8.0% | 6.1% |
| Sweden Democrats | 25.2% | 12.1% | 17.5% |
| Other parties | 1.5% | 1.4% | 1.6% |
| Turnout | 87.8% | 84.7% | 84.9% |
Share of valid votes in each district. The tick on each bar is the whole kommun's result (Nykvarn). Change since 2022 in percentage points, where Valmyndigheten says the district can be compared. Early votes that arrived late are counted in the kommun's collection district and are in no district's shares. The election is not part of the VERA PI Score. Source: Valmyndigheten, final result, published 7 October 2026. Valmyndigheten's data
Getting around
The nearest stop is Nykvarn – 170 m on foot, about 2 minutes. 2 school units stand within 500 m of the street.
The walk is measured along OpenStreetMap’s streets and paths from the nearest point of the street, at 80 m a minute – never shorter than the straight line, which is shown beside it.
| Kind | Stop | Walk | Time | Straight line |
|---|---|---|---|---|
| Tunnelbana | none within 6 km | – | – | – |
| Rail (pendeltåg, Roslagsbanan, Saltsjöbanan) | Nykvarn | 170 m | 2 min | 110 m |
| Tram and light rail | none within 6 km | – | – | – |
Active units in Skolverket’s register, by distance from the street.
Named parks whose centre lies within 600 m, the largest first.
Stops, streets, paths and parks: © OpenStreetMap contributors, ODbL 1.0. School units: Skolverket’s school-unit register (open data).
Prices – kommun level
SCB publishes sale prices by kommun and län – not by street. These are Nykvarn’s and Stockholms län’s, never Södertäljevägen’s.
Nykvarn’s prices since 1981 · Stockholms län’s bostadsrätter since 2000
Sales of småhus by kommun and of bostadsrätter by län: Source: Statistics Sweden, CC BY 4.0.
Streets nearby
Sources and licences
Every figure is official statistics from Statistics Sweden (SCB) under CC BY 4.0 – «Source: Statistics Sweden» – for the period stated beside it; boundaries from SCB’s DeSO 2025 and Stockholms stad’s Stadskarta (© Stockholms stad, Stadsbyggnadskontoret, CC BY); school units from Skolverket; buildings, stations and parks © OpenStreetMap contributors (ODbL 1.0). Nothing here is a valuation. VERA PI has processed the figures (sums over DeSO areas, changes, ranks). Streets, buildings, stops and parks: © OpenStreetMap contributors (ODbL 1.0) – one street per name and kommun, its parts merged by VERA PI.