


Akutmottagningen, Södersjukhuset
Sjukhusbacken 12 · 424 m
Open 24/7 · 08-123 621 20
Södermalm · Stockholm · Street guide
Maria Bangata is a residential street of Södermalm, 300 metres long from Rosenlundsgatan to Maria Skolgata. Its houses went up between 1864 and 1922. Here is every house on it – when it was built, who drew it and who owns it today – and what this corner of Södermalm is like to live in.
Better placed than 95 % of Stockholm's 4,346 streets – no. 35 of 242 in Södermalm.

Coming: Heritage – Stadsmuseet's inventories · Restaurants & culture · Safety – Brå · Air · Flood
Each part is a rank among all of Stockholms stad's streets; the parts are weighted and the total ranked again – the same measure for every street, so any two can be compared and shared. It is VERA PI's own ranking, not a price and not a valuation.
Ask VERA · VERA PI
Three questions to VERA PI's assistant – free for members. The answers are built on VERA PI's own data for the place, with source and date.
General information – not financial or legal advice. Your question is not stored. About Ask VERA
VERA PI
The median of the street's 5 residential buildings gets 5.9 hours of direct sun on a clear day on 21 March, on its sunniest facade – Stockholm's median is 7.8 hours.
The north side, whose facades face south, gets the most sun: 6.2 hours on 21 March in the median, against 1.3 hours on the south side.
21 March the equinox
5.9 hours
Stockholm 7.8 hdaylight 12.2 h
21 December the solstice
0.3 hours
Stockholm 1.7 hdaylight 6.1 h
21 September trees in leaf
5.8 hours
Stockholm 7.8 hdaylight 12.3 h
The top 5 of 5 on the street.
Large figure: 21 March21 December21 September, trees in leaf
The sun in SödermalmThe sunniest homes in Stockholm
Solläge is the number of hours of direct sun on a clear day on 21 March on a building's sunniest facade – at least 8 metres long – at its middle floor. Winter is the same on 21 December; on 21 September the trees count, in leaf. Neighbouring buildings, the terrain and the trees cast the shade. Medians are of the residential buildings; the lists name apartment buildings only – houses and terraced houses count in the medians but are never shown one by one.
The sun's path: NOAA's solar calculation. The buildings' heights: Stockholms stad's 3D buildings (the city planning office, SBK) – only derived values are shown, hours and rounded heights. Streets, addresses and trees: © OpenStreetMap contributors, ODbL 1.0. Calculated 21 October 2026.
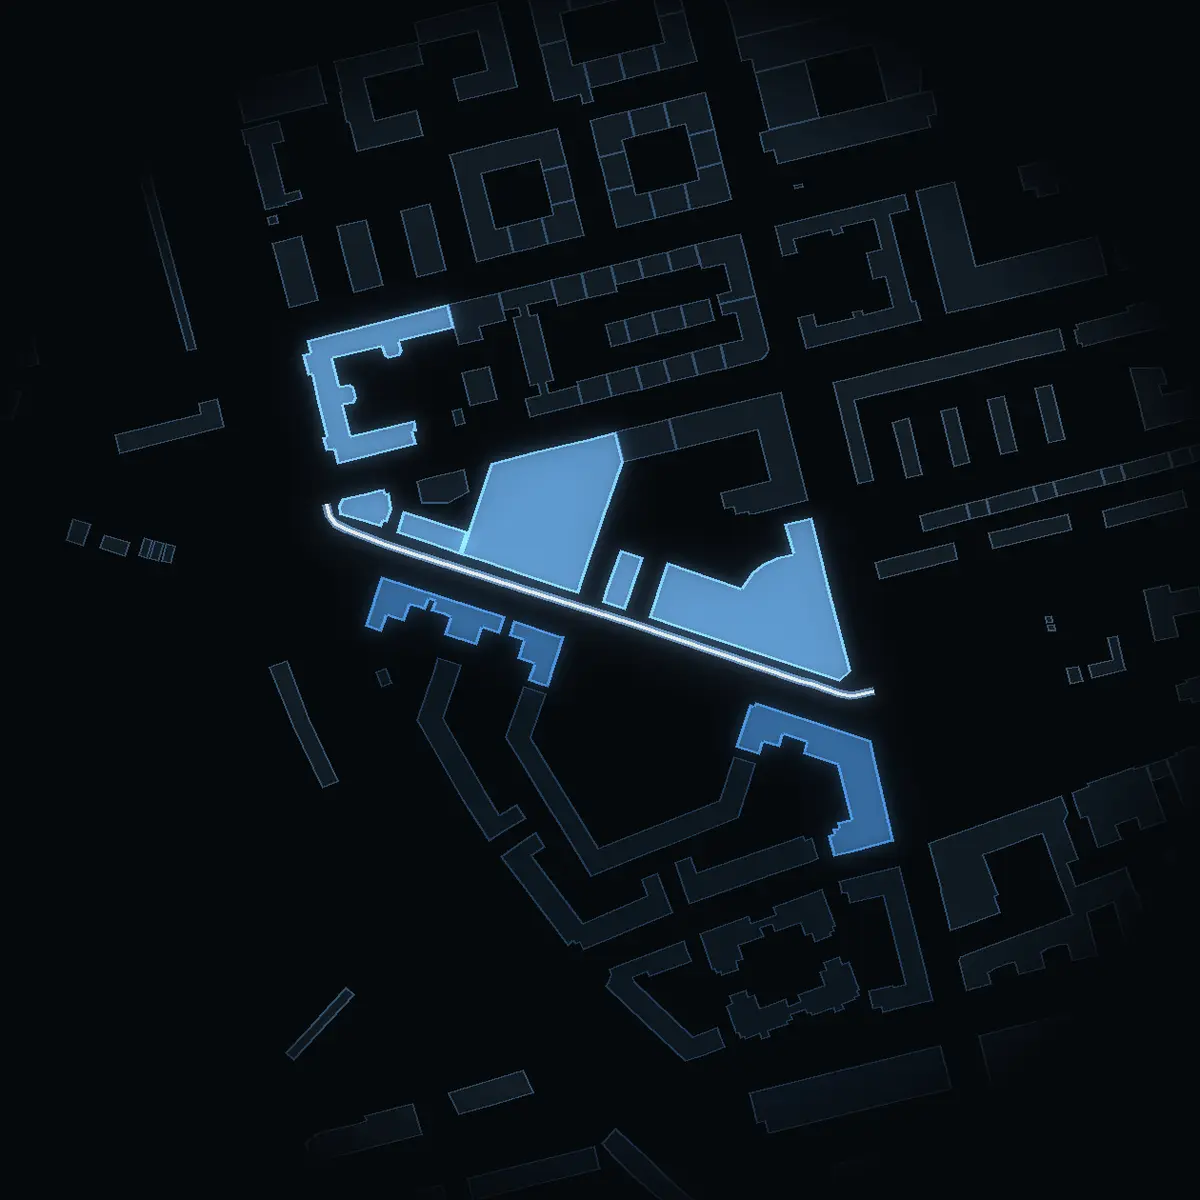
Every house on Maria Bangata with an address, on the map – its buildings drawn at their real heights from the city's 3D model. Walk along the street with the slider, switch between the odd and the even side, or tap a house.
Skip the mapThe bars are the houses at their heights from the city's 3D model – the odd side above the line, the even side below. Tap one to see the house.
7 houses with an address · 5 in Stadsmuseet's inventories. Tap one for its own page.
The houses of Maria Bangata in photographs, each under a free licence, credited to its photographer.
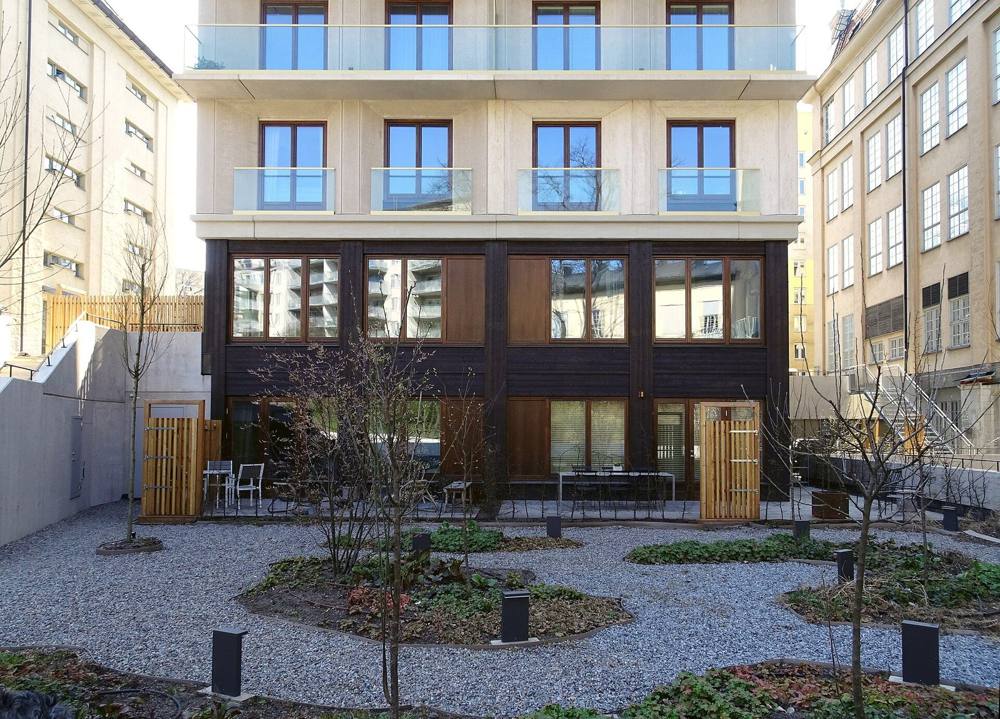
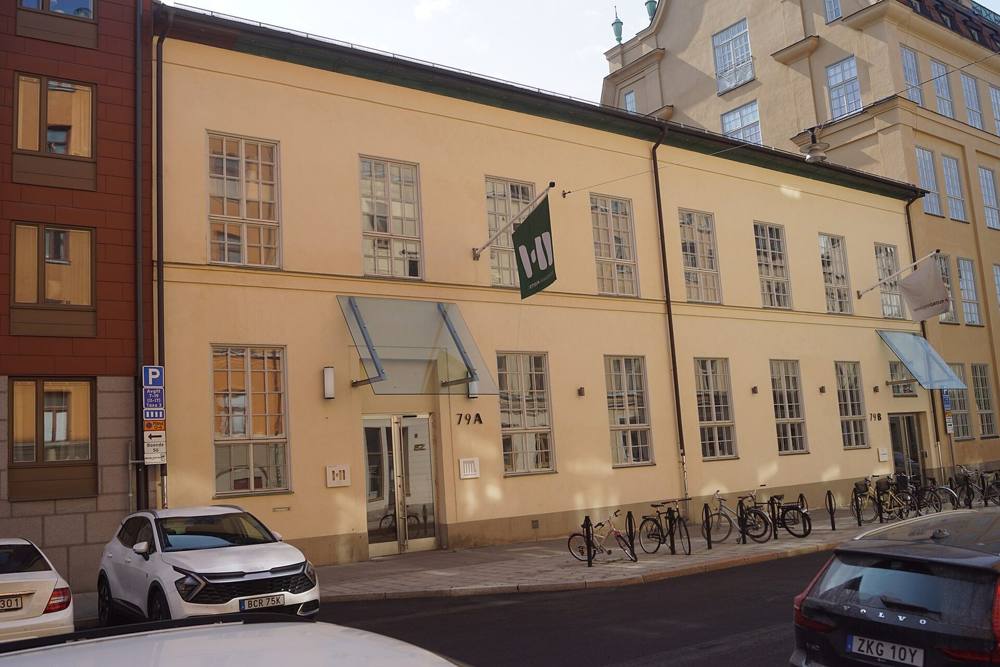
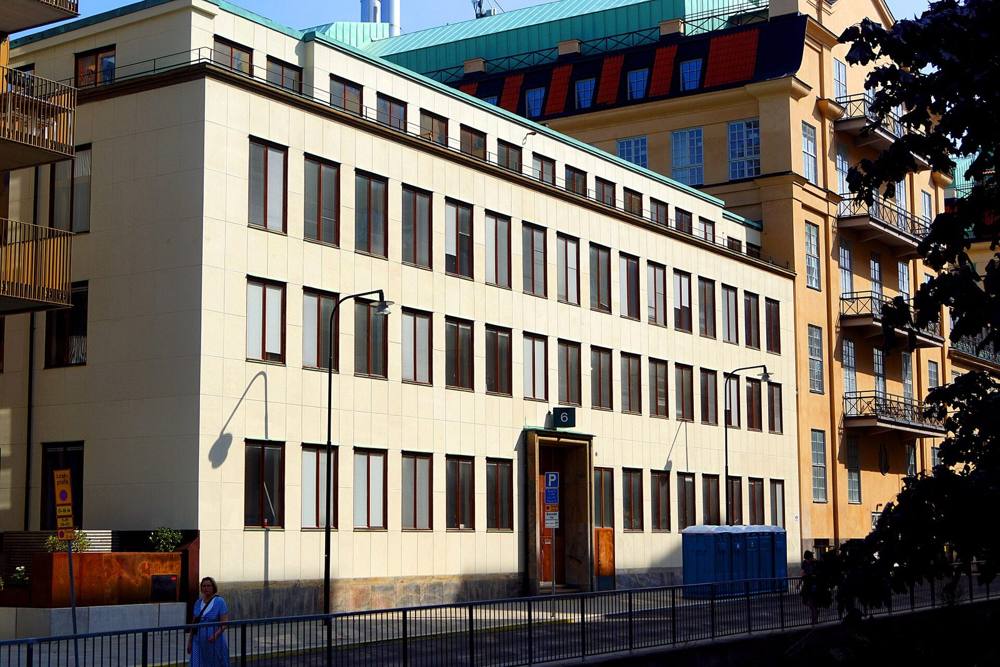
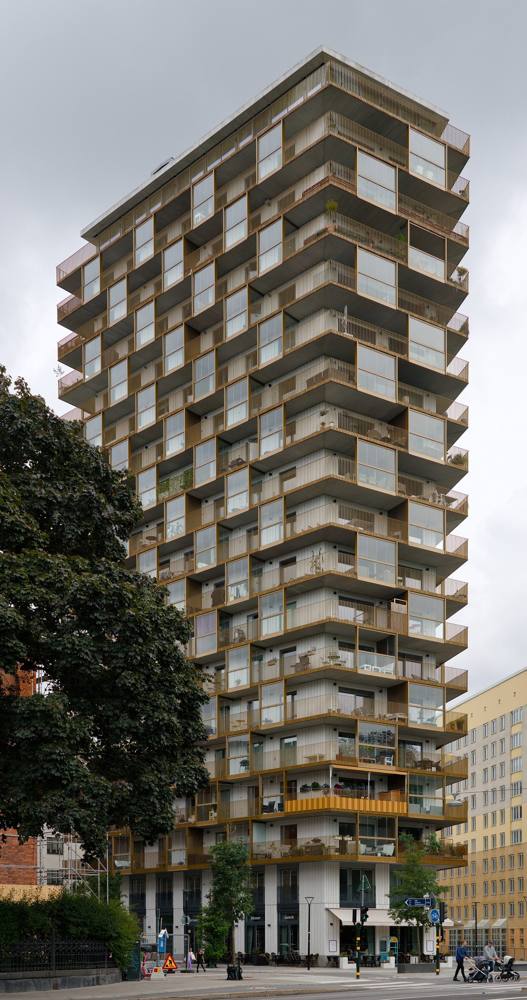
Of the 7 houses on Maria Bangata with an address, one is owned by housing associations (bostadsrättsföreningar), matched in Bolagsverket's register of 19 October 2026. None of them has a public annual report for 2025 or later yet; where an older one exists, it is kept below as history. For 6 houses no association was found: the sources do not say who owns them.
Figures from each association's own annual report (årsredovisning), as linked from the estate agencies' listings or the association's own site. Only reports for 2025 or later count as current; older years are history and dated. Names and organisation numbers from Bolagsverket's register, 19 October 2026. «Matched by name»: the association's name is the property's designation, and no report or listing has confirmed the address yet. Tap a house for its own page.
The street set against Stockholm and the whole of Sweden. Each figure is for the finest area its publisher reports – the street's own statistical area, Södermalm or the district of Södermalm – and says which. Nothing is modelled.
Share of homes, 2025 · The street's areas
16 percentage points above Stockholm
Share of homes, hyresrätt, 2025 · The street's areas
8.1 percentage points below Stockholm
Sales in the 12 months to September 2026 · Södermalm
24 % above Stockholm
July–September 2026 against 2025 · Södermalm
2.6 percentage points above Stockholm
1 January 2026 · Södermalm
20 % above Stockholm
Average years queued for the existing flats let in 2025 · The inner city
70 % above Stockholm
Share of residents, 2025 · The street's areas
1.2 percentage points above Stockholm
Share of households, 2025 · The street's areas
10 percentage points below Stockholm
Share of households, 2025 · The street's areas
11 percentage points above Stockholm
Share of residents aged 25–65, 2025 · The street's areas
8.9 percentage points above Stockholm
Löneinkomst per person 20+, SEK thousand a year, 2024 – the latest SCB publishes per area · The street's areas
14 % above Stockholm
Per person 20+, SEK thousand a year, 2024 – the latest SCB publishes per area · The street's areas
13 % above Stockholm
SEK thousand a month, people 20+, capital income not included – SCB's preliminary monthly figures, not published per area · Stockholm
Not published for the street's areas.
January–June 2026, as above · Stockholm
Not published for the street's areas.
In traffic, registered to residents, per 1,000 residents, 2025 · The street's areas
32 % below Stockholm
The street's areas: Statistics Sweden's DeSO 0180C3480, 2,266 residents – in SCB's areas Mellersta Högalid. Incomes are means, so a few very large incomes pull them up; capital income includes gains on sales of shares and property. Sources: Statistics Sweden (read 2026-10-21), Svensk Mäklarstatistik, Bostadsförmedlingen, Brå.
Seven homes in ten here are bostadsrätter – you buy a share in the association that owns the building, and pay it a monthly fee. The rest are rented, through the city's queue or second hand.
Up 10.5 % in a year. Prices per m², July–September 2026:
Svensk Mäklarstatistik, bostadsrätter, updated 8 October 2026. Averages; the source publishes no medians. Source
The county's median bostadsrätt sold for 5.2 times as much in 2025 as in 2000 – SEK 3.5m against SEK 0.68m.
Median sale price of a bostadsrätt, SEK thousand – Stockholm county, the finest level Statistics Sweden publishes; not the street. SCB, BO0501C.
About 17,800 kr a month for 100 m² at the median. Stockholm as a whole: 1,772 kr per m².
Rent here runs 20 % above the city: 2,135 kr per m² a year in Södermalm in 2026, against 1,772 kr for Stockholm and 1,483 kr for Sweden.
Median rent per m² a year, for the district of Södermalm as Statistics Sweden reports it. Hover or tap a point for the figure; on a keyboard, tab to the chart and use the arrow keys.
Bostadsförmedlingen i Stockholm, statistics for 2025. Source
Safety is told for the district, never for the street. Stockholm stad's figures stand here; the district of Södermalm is coming.
Coming: the district of Södermalm – Brå's reported crime 2015–2025 and the city's safety survey 2026.
Until then the district's own figures are at Brå's statistics and in Stockholms stad's safety survey. Reported crime is not all crime, and local figures go by where the crime happened. Source: Brå, reported offences 2025.
2,266 people live in the street's area. 36 % of them are over fifty (Stockholm: 35 %), 17 % of the households have children, and of those aged 25–65, 56 % hold a university degree of three years or more (Stockholm: 47 %).
18 % of the residents here are 65 or over – against 17 % across Stockholm; the street's areas have more people aged 20–49.
Share of residents in each age group, 2025. Statistics Sweden.
Mean net income in the street's areas was SEK 507k a year per person aged 20 and over in 2024, up from 449k in 2019 – Stockholm: 468k in 2024.
Walking times along the street network from the nearest point of Maria Bangata, at 80 metres a minute.
Stations: SL and Trafiklab; the walk is measured along OpenStreetMap's paths and pavements, so it is never shorter than the straight line. Schools: Skolverket's school-unit register.
Streets next door: Maria SkolgataRosenlundsgatanSköldgatanEkermans GrändDoktor Abelins GataSamaritgrändHögbergsbackenKrukmakarbacken
The nearest care and everyday places from Maria Bangata, nearest first, with the way there in Google Maps or Apple Maps. Emergency care is shown however far it is; everything else within 2 km.
In an emergency, call 112Medical advice day and night: 1177
Sjukhusbacken 12 · 424 m
Open 24/7 · 08-123 621 20
Tideliusgatan 14 · 383 m
Hjalmar Cederströms gata 14 · 537 m
Open 24/7 · 08-123 642 66
Krukmakargatan 37A · 224 m
206 m
412 m
95 m
75 m
210 m
418 m
Torkel Knutssonsgatan 20 · 348 m
Distance in a straight line from the nearest point of the street; the walk is estimated at 1.3 times that, at 80 metres a minute. Source: © OpenStreetMap contributors (ODbL), emergency and urgent care and health centres checked against 1177, police stations against Polisen, read 21 October 2026.
The general election of 13 September 2026, final result, in the 2 voting districts Maria Bangata runs through, the largest share of the street first. The figures are each whole district's, not just the street's.
The districtStockholms kommun
| Party | Stockholm | County | Sweden |
|---|---|---|---|
| Moderates | 19.1 % | 21.8 % | 19.9 % |
| Centre Party | 9.8 % | 8.6 % | 7.0 % |
| Liberals | 7.1 % | 6.8 % | 5.3 % |
| Christian Democrats | 3.9 % | 4.9 % | 6.2 % |
| Social Democrats | 26.3 % | 26.0 % | 28.0 % |
| Left Party | 13.0 % | 10.2 % | 8.4 % |
| Green Party | 11.1 % | 8.0 % | 6.1 % |
| Sweden Democrats | 8.4 % | 12.1 % | 17.5 % |
| Other parties | 1.2 % | 1.4 % | 1.6 % |
| Turnout | 85.8 % | 84.7 % | 84.9 % |
Share of valid votes in each district. The tick on each bar is Stockholms kommun. Change since 2022 in percentage points. Early votes that arrived late are counted in the municipality's collection district and are in no district's shares. The election is not part of the VERA PI Score. Source: Valmyndigheten, final result, published 7 October 2026. Valmyndigheten's data
Two cards for Maria Bangata: the street in figures, and its VERA PI Score. Share one and the link arrives with that card as its picture; save it for Instagram. Every house on the street has its own card too.

Buildings and heights: building outlines © OpenStreetMap contributors, ODbL 1.0 (Geofabrik's Sweden extract, read 20 October 2026); heights (rounded), property designations and use derived from Stockholms stad's 3D model (SBK 3D-Byggnader LOD1; the catalogue states no licence).
The houses: Stadsmuseet i Stockholm, Byggnadsinventering Industrimiljöer i Stockholm. Innerstaden (Stockholms stadsmuseum, industrimiljöinventering 1979), Katarinaberget (1972) and Södra Maria del av Högalid (1978), via Stockholmskällan – year built (building permit to final inspection), architect, client, master builder and facade, each read three times from the scanned page and linked to that page. Facades and later changes are quoted in the inventory's Swedish.
Housing associations: Bolagsverket's open register (värdefulla datamängder), 19 October 2026, for names and organisation numbers; fees, debt and flats from each association's own annual report, as linked from estate agencies' listings or the association's site – figures for 2025 or later are current, older ones are history.
People, homes, income, education, cars and rents: Statistics Sweden (SCB), CC BY 4.0 – DeSO tables for 2025 (population, households, tenure, education, cars) and 2024 (income, the latest per area), the preliminary monthly income statistics HE0110M for 2025–2026, rents by district (BO0406) and the county's bostadsrätt prices (BO0501C); read 2026-10-21.
Prices: Svensk Mäklarstatistik, bostadsrätter, updated 8 October 2026. Asking prices: VERA PI's read of the estate agencies' own adverts, 20 October 2026 – asking prices, not sales; no Hemnet, no Booli. Rental queue: Bostadsförmedlingen i Stockholm, 2025.
Getting around: SL and Trafiklab stops; walks along OpenStreetMap's network. Schools: Skolverket, school unit register. Parks: OpenStreetMap.
The VERA PI Score: VERA PI's own ranking of Stockholm stad's 4,346 streets, version 1 – not a price and not a valuation.
Photographs: Wikimedia Commons, each under the licence named in its caption.