Akutmottagningen, Capio S:t Görans Sjukhus
Sankt Göransgatan 139, Stockholm
Open 24/7 · 08-587 010 00
Places
På svenskaSamma sida på svenska Stockholms län26 municipalities on the map Stockholm stadEvery district ÖstermalmStreet by street StrandvägenHouse by house For saleHomes on the market nowOn Lundagatan
The street450 mClose byCare and everydayThe area around itSCB, DeSOGetting aroundStops, schools, parksSolnaThe municipalityVERA PI
The companyvpios.com All markets
street
19 buildings stand along its 450 m in Solna. The DeSO area it runs through has a mean net income of SEK 421k, and 74% of their dwellings are bostadsrätter. Västra skogen (tunnelbana) is a 9-minute walk.
56.2VERA PI Scoreno. 158 of 365 in Solna
The street as OpenStreetMap maps it, its area as SCB counts it.
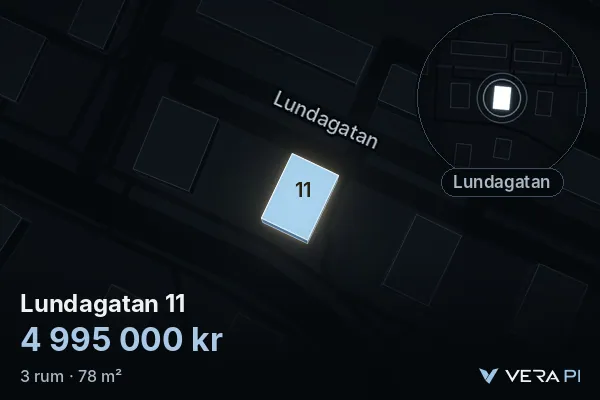
Shared home · for sale on Lundagatan
 For sale
SEK 5m64,038 SEK/m²
Co-op flat · 3 rooms · 78 m²
Fee 4,855 SEK/month
Notar · Agent's listing
Free for Metro Mode readers
Become a member and see everything about Lundagatan: every house, the prices, what’s for sale and the map. It takes 30 seconds.
VERA PI Score
Better placed than 56% of Stockholm stad's 4,346 streets – no. 158 of 365 in Solna.
Each part is a rank among all of Stockholms stad's streets; the parts are weighted and the total ranked again – the same measure for every street, so any two can be compared and shared. It is VERA PI's own ranking, not a price and not a valuation. Streets outside Stockholm stad are placed in Stockholm stad's distribution; a street with no metro, commuter-rail or tram stop within a 6 km walk gets 0 for getting around.
Sources: © OpenStreetMap contributors, SL's stops, Skolverket, SCB (mean net income 2024 per DeSO) · VERA PI Score v1, calculated 21 Oct 2026, 14:52.
The street
Lundagatan is a residential street of about 450 m in Solna. OpenStreetMap draws 19 buildings within 25 m of its line, typically 6.5 floors high where the floors are mapped (18 of them).
OpenStreetMap’s own tags – most Swedish buildings carry no use, so «not tagged» is common and says nothing about the building.
Addresses
The street's current addresses in VERA PI's databases, each with the property it belongs to – 12 properties. An address with its own building page on verapi.se is linked.
| Address | Postcode | Property |
|---|---|---|
| Lundagatan 1 A | 171 63 Solna | Solna Repslagaren 4 |
| Lundagatan 1 B | 171 63 Solna | Solna Repslagaren 4 |
| Lundagatan 1 C | 171 63 Solna | Solna Repslagaren 4 |
| Lundagatan 2 A | 171 63 Solna | Solna Laboratoriet 6 |
| Lundagatan 2 B | 171 63 Solna | Solna Laboratoriet 6 |
| Lundagatan 3 A | 171 63 Solna | Solna Björnen 8 |
| Lundagatan 3 B | 171 63 Solna | Solna Björnen 8 |
| Lundagatan 4 A | 171 63 Solna | Solna Hälla 13 |
| Lundagatan 4 B | 171 63 Solna | Solna Hälla 13 |
| Lundagatan 5 | 171 63 Solna | Solna Björnen 13 |
| Lundagatan 6 A | 171 63 Solna | Solna Hälla 19 |
| Lundagatan 6 B | 171 63 Solna | Solna Hälla 19 |
| Lundagatan 7 | 171 63 Solna | Solna Björnen 13 |
| Lundagatan 8 A | 171 63 Solna | Solna Hälla 18 |
| Lundagatan 8 B | 171 63 Solna | Solna Hälla 18 |
| Address | Postcode | Property |
|---|---|---|
| Lundagatan 8 C | 171 63 Solna | Solna Hälla 18 |
| Lundagatan 8 D | 171 63 Solna | Solna Hälla 18 |
| Lundagatan 9 | 171 63 Solna | Solna Björnen 10 |
| Lundagatan 10 A | 171 63 Solna | Solna Hälla 18 |
| Lundagatan 10 B | 171 63 Solna | Solna Hälla 18 |
| Lundagatan 10 C | 171 63 Solna | Solna Hälla 18 |
| Lundagatan 10 D | 171 63 Solna | Solna Hälla 18 |
| Lundagatan 10 E | 171 63 Solna | Solna Hälla 18 |
| Lundagatan 11 | 171 63 Solna | Solna Björnen 10 |
| Lundagatan 13 | 171 63 Solna | Solna Björnen 9 |
| Lundagatan 14 | 171 63 Solna | Solna Hälla 17 |
| Lundagatan 16 | 171 63 Solna | Solna Hälla 16 |
| Lundagatan 18 | 171 63 Solna | Solna Hälla 15 |
| Lundagatan 20 | 171 63 Solna | Solna Hälla 15 |
Belägenhetsadress, Fastighetsindelning © Lantmäteriet, processed by VERA PI, CC BY 4.0. Read 29 Oct 2026.
The nearest care and everyday places from Lundagatan, nearest first, with the way there in Google Maps or Apple Maps. Emergency care is shown however far it is; everything else within 2 km.
In an emergency, call 112Medical advice day and night: 1177
Sankt Göransgatan 139, Stockholm
Open 24/7 · 08-587 010 00
Karolinska vägen 39 · 1.7 km
Anna Steckséns gata 35 · 1.6 km
Open 24/7 · 08-123 771 02
Skytteholmsvägen 39A · 325 m
Hotellgatan 1 · 508 m
Skytteholmsvägen 47 · 447 m
Supermarket · 122 m
by Postgången 40 · Post office · 717 m
Infanterigatan 13 · 224 m
Storgatan 22
Ängsstigen 1, Sundbyberg · 1.8 km
Sundbybergsvägen 15 · 95 m
Distance in a straight line from the nearest point of the street; the walk is estimated at 1.3 times that, at 80 metres a minute. Source: © OpenStreetMap contributors, emergency departments, urgent care and health centres from 1177 (Region Stockholm), police stations from Polisen, October 2026.
The area around it
The street runs through one of SCB’s DeSO areas – Ingenting. Together they have 1,466 people (2025) with a mean net income of SEK 421k (2024), +1.9% against Solna as a whole. These are the areas’ figures, not the street’s: SCB counts people by area, never by street.
Dwellings in the DeSO areas the street runs through, 732 in all.
People 2025, net income 2024 and dwellings by tenure by DeSO area: Source: Statistics Sweden, CC BY 4.0 – an area counts where at least a tenth of the street runs through it.
The general election of 13 September 2026, final result, in the 2 voting districts Lundagatan runs through, the largest share of the street first. The figures are each whole district's, not just the street's.
The districtSolna
| Party | Solna | County | Sweden |
|---|---|---|---|
| Moderates | 21.8% | 21.8% | 19.9% |
| Centre Party | 9.5% | 8.6% | 7.0% |
| Liberals | 6.6% | 6.8% | 5.3% |
| Christian Democrats | 4.6% | 4.9% | 6.2% |
| Social Democrats | 28.0% | 26.0% | 28.0% |
| Left Party | 9.9% | 10.2% | 8.4% |
| Green Party | 7.9% | 8.0% | 6.1% |
| Sweden Democrats | 10.4% | 12.1% | 17.5% |
| Other parties | 1.4% | 1.4% | 1.6% |
| Turnout | 85.2% | 84.7% | 84.9% |
Share of valid votes in each district. The tick on each bar is the whole municipality's result (Solna). Change since 2022 in percentage points, where Valmyndigheten says the district can be compared. Early votes that arrived late are counted in the municipality's collection district and are in no district's shares. The election is not part of the VERA PI Score. Source: Valmyndigheten, final result, published 7 October 2026. Valmyndigheten's data
Getting around
The nearest stop is Västra skogen – 690 m on foot, about 9 minutes. 5 school units stand within 500 m of the street.
The walk is measured along OpenStreetMap’s streets and paths from the nearest point of the street, at 80 m a minute – never shorter than the straight line, which is shown beside it.
| Kind | Stop | Walk | Time | Straight line |
|---|---|---|---|---|
| Tunnelbana | Västra skogen | 690 m | 9 min | 570 m |
| Rail (pendeltåg, Roslagsbanan, Saltsjöbanan) | Solna | 2,090 m | 26 min | 1,400 m |
| Tram and light rail | Solna centrum | 990 m | 12 min | 830 m |
Active units in Skolverket’s register, by distance from the street.
Named parks whose centre lies within 600 m, the largest first.
Stops, streets, paths and parks: © OpenStreetMap contributors. School units: Skolverket’s school-unit register (open data).
Prices – municipality level
SCB publishes sale prices by municipality and län – not by street. These are Solna’s and Stockholms län’s, never Lundagatan’s.
Solna’s prices since 1981 · Stockholms län’s bostadsrätter since 2000
Sales of småhus by municipality and of bostadsrätter by län: Source: Statistics Sweden, CC BY 4.0.
Sources and licences
Every figure is official statistics from Statistics Sweden (SCB) under CC BY 4.0 – «Source: Statistics Sweden» – for the period stated beside it; boundaries from SCB’s DeSO 2025 and Stockholms stad’s Stadskarta (© Stockholms stad, Stadsbyggnadskontoret, CC BY); school units from Skolverket; buildings, stations and parks © OpenStreetMap contributors. Nothing here is a valuation. VERA PI has processed the figures (sums over DeSO areas, changes, ranks). Streets, buildings, stops and parks: © OpenStreetMap contributors – one street per name and municipality, its parts merged by VERA PI.